Wide Valuation Dispersion Creates Stock-Picking Opportunities

Our A+ Investor Value Grade uses percentile rankings to assess whether stocks are cheap or expensive relative to all other stocks. This approach has two key advantages: It allows comparisons across many stocks regardless of prevailing market conditions, and it makes it easier to identify both potential investments and stocks to avoid.
We take an updated look at the average valuation ratios underlying the A+ Investor Value Grade. All data is from AAII’s Stock Investor Pro and S&P Global Market Intelligence as of April 14, 2026.
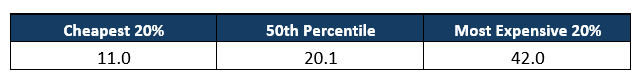
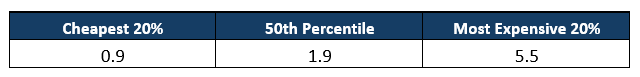
The median stock currently trades at 20.1x earnings and 1.9x book value. Stocks in the cheapest 20% offer meaningful discounts across all measures—for instance, a price-earnings (P/E) ratio of 11.0. Meanwhile, the most expensive stocks trade at elevated multiples, with price-earnings ratios above 42.0. This wide dispersion between cheap and expensive stocks underscores why relative valuation rankings remain valuable for identifying opportunities.
Below is a detailed look at each of the six valuation measures.
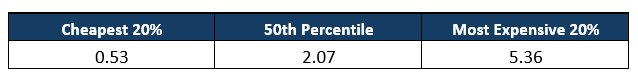
Price to Sales
The price-to-sales (P/S) ratio is determined by dividing market price per share by sales per share for the most recent 12 months. Seeking undervalued stocks based on the price-to-sales ratio was first popularized by Kenneth Fisher in his book “Super Stocks” (McGraw-Hill, 1984).
Proponents of the price-to-sales ratio argue that earnings-based approaches to selecting stocks are inferior because earnings are influenced by many management assumptions trickling through the accounting books. The price-to-sales ratio can provide a meaningful valuation tool when negative earnings render earnings-based models useless.
While price-to-sales ratios of below 1.00 have traditionally been viewed as indicating cheaply valued stocks, most stocks currently trade with ratios above 1.00.
Price to Earnings
The price-earnings ratio, or earnings multiple, is one of the most popular measures of company value. It is computed by dividing the current stock price by earnings per share for the most recent four quarters.
The price-earnings ratio is followed by so many because it relates the market’s expectation of future company performance—embedded in the price component of the equation—to the company’s recent earnings performance. The greater the expectation for future growth, the higher the multiple of current earnings investors are willing to pay. However, there is no guarantee that these expectations will be met, making stocks with high price-earnings ratios risky.
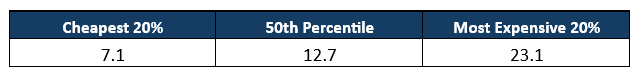
Enterprise Value to EBITDA
The ratio of enterprise value to earnings before interest, taxes, depreciation and amortization (EBITDA) is determined by dividing enterprise value for the most recent quarter by EBITDA for the most recent 12 months. Enterprise value is a company’s market value of equity (including preferred stock) plus its interest-bearing debt minus excess cash.
Some investors feel that a company’s enterprise value relative to its EBITDA is a better way to measure company value than the price-earnings ratio alone. The ratio is neutral to the company’s capital structure and capital expenditures (capex). EBITDA is an approximation of cash flow but is not actual cash flow.
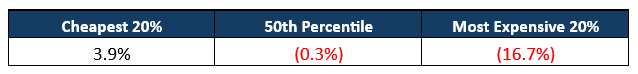
Shareholder Yield
A stock’s shareholder yield—the sum of its buyback yield and dividend yield—shows the percentage of total cash a company is paying out to its shareholders, either in the form of a cash dividend or as expended cash to repurchase its shares in the open market. Thus, if a company is paying a 2% dividend yield and has a 2% buyback yield, its shareholder yield would be 4%.
Unlike other valuation measures, shareholder yield is inversely related to value, with higher shareholder yields implying lower valuations. A negative shareholder yield occurs when the percentage increase in the number of shares outstanding is greater than the stock’s dividend yield.
Price to Book Value
The price-to-book-value (P/B) ratio is calculated by dividing the share price by book value per share. Book value is generally determined by subtracting total liabilities from total assets. It represents the value of the shareholder’s equity based on historical accounting decisions.
The price-to-book ratio was a favorite measure of Benjamin Graham and his disciples who sought companies with a share price below the book value per share.
Small companies have been trading at historically low price-to-book ratios relative to large companies over the past few years. Because there are more small exchange-traded companies than large ones, the lowest quintile and median price-to-book values are both much lower than the highest quintile.
Price to Free Cash Flow
The price-to-free-cash-flow (P/FCF) ratio is calculated by dividing the share price by free cash flow per share for the most recent 12 months. Cash flow is reported on the cash flow statement. It is the sum of cash from operations, cash from investing and cash from financing adjusted for exchange rate effects. Free cash flow is calculated by subtracting capex and dividend payments from cash flow from operations.
The cash flow statement is harder to manipulate through accounting techniques than earnings. Unlike earnings, which are an accounting figure, cash flow represents the net total of cash flowing into and out of the company over a given period.
The higher the ratio, the more free cash investors expect a company to generate in the future—and the more potential downside.
AAII Stock Bracket Challenge Semifinals Update
The AAII Stock Bracket Challenge is now down to two stocks. Thirteenth seed JPMorgan Chase & Co. (JPM) closed first seed Apple Inc.’s (AAPL) tournament account. Eleventh seed Alphabet Inc. (GOOGL) left 15th seed Coca-Cola Co. (KO) drained in the other semifinal matchup.
The continued shift in investors’ preference toward growth sectors like information technology and away from consumer sectors benefited Alphabet. JPMorgan got a lift from investor dollars flowing into the financials sector.
Four of the top six contestants have 11 correct picks out of a possible 14. Two contestants—David’s picks and FshRMN—are vying for the top spot following the semifinal round. Like a three-point shot, nothing is guaranteed, as the championship round awards 32 points to everyone with the winning stock in their brackets.
These are two well-known stocks followed by many AAII members. It will be interesting to see which one comes out on top.
The Championship round is running from April 15–21, ending at market close on Tuesday, April 21, 2026. Check your bracket, track live results and follow the leaderboard here.
Join us for our Week 4 live stream on Wednesday, April 22, at 1:00 p.m. Central Time to discover the winning stock and the champion AAII member who topped the poll. We’ll also highlight additional hidden gems on AAII.com that will help you analyze your favorite stocks—and the ones that could become your new favorites.

More on AAII.com
Understanding AAII’s Revised Value Grade
AAII’s Value Grade for stocks incorporates six fundamental variables into a single value grade to help judge which stocks are potential bargains and which are expensive.Price-Sales Ratios: A New Tool for Measuring Stock Popularity
Ken Fisher proposed a substitute to the price-earnings ratio in the June 1984 AAII Journal, introducing members to the now-common ratio based on price relative to sales.Screening on Dividend Yield to Unlock Stocks With High Potential
The April 2026 AAII Journal explains how relative dividend yield serves as a valuation measure that helps indicate whether a company may be trading at a discount compared to its historical range.
AAII Sentiment Survey
Neutral sentiment among individual investors about the short-term outlook for stocks increased in the latest AAII Sentiment Survey. Meanwhile, optimism and pessimism decreased.
Bullish sentiment, expectations that stock prices will rise over the next six months, decreased 4.0 percentage points to 31.7%. Bullish sentiment is below its historical average of 37.5% for the ninth consecutive week.
Neutral sentiment, expectations that stock prices will stay essentially unchanged over the next six months, increased 4.2 percentage points to 25.5%. Neutral sentiment is below its historical average of 31.5% for the 91st time in 93 weeks.
Bearish sentiment, expectations that stock prices will fall over the next six months, decreased 0.2 percentage points to 42.8%. Bearish sentiment is unusually high and is above its historical average of 31.0% for the 10th consecutive week.
The bull-bear spread (bullish minus bearish sentiment) decreased 3.8 percentage points to –11.1%. The bull-bear spread is below its historical average of 6.5% for the 10th consecutive week.
This week’s special question asked AAII members if their inflation expectations have changed since the end of February.
Here is how they responded:
Yes, I expect inflation to be much higher: 19.3%
Yes, I expect inflation to be moderately higher: 46.0%
Yes, I expect inflation to be temporarily higher: 24.1%
No, my inflation expectations are unchanged: 9.6%
Not sure/no opinion: 0.5%
This week’s Sentiment Survey results:
Bullish: 31.7%, down 4.0 points
Neutral: 25.5%, up 4.2 points
Bearish: 42.8%, down 0.2 points
Historical averages:
Bullish: 37.5%
Neutral: 31.5%
Bearish: 31.0%
See more Sentiment Survey results.