

Momentum stocks have had a strong year. The S&P 500 Momentum index is up 27.8% year to date. New research from S&P Global Market Intelligence explains why: The current combination of rising growth and rising inflation has historically been a sweet spot for the momentum factor.
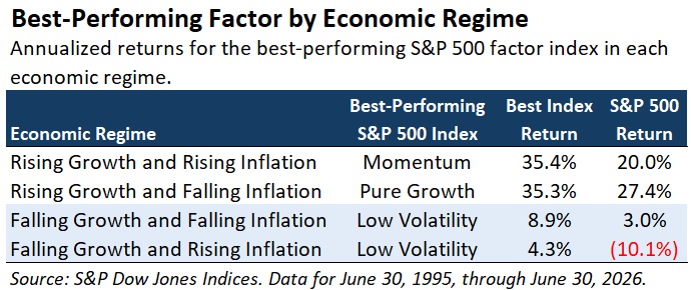
Over the past 31 years (June 30, 1995, to June 30, 2026), momentum has posted a 35.4% annualized return during economic regimes characterized by rising growth and rising inflation, nearly double the S&P 500 index’s performance in those same periods. The S&P 500 Momentum is tracked by Invesco S&P 500 Momentum ETF (SPMO).
Momentum is one of several “factors”—traits of stocks found to explain performance beyond what market risk alone can account for. The AAII Model Shadow Stock Portfolio is a long-running factor-based portfolio. It targets both the size factor (smallest 10% of all exchange-listed stocks) and the value factor [price-to-book-value (P/B) ratios in the lowest 10% of all exchange-listed stocks]. The portfolio is based on the seminal 1993 Journal of Financial Economics paper by Nobel laureate Eugene Fama and Dartmouth College professor Kenneth French, “Common risk factors in the returns on stocks and bonds.”
Many other factors have been identified in the decades since the paper’s publication. S&P Global looked at seven factors used by S&P 500 subset indexes to track performance.
Momentum, measured by the S&P 500 Momentum, realized the highest annualized return over the entire 31-year period: 13.7%. This long-term figure reflects performance across all economic environments, including the regimes where momentum has struggled. The index seeks stocks with the strongest risk-adjusted price returns over the past 12 months, with the most recent month excluded.
Quality, measured by the S&P 500 Quality index, trailed the S&P 500 Momentum’s annualized return by three basis points (13.70% versus 13.73%) but realized the highest risk-adjusted performance at 0.97, meaning it delivered the most return per unit of volatility. The index seeks stocks with high return on equity (ROE), low accruals and low financial leverage. It is tracked by Invesco S&P 500 Quality ETF (SPHQ).
Neither factor consistently led throughout the entire period. Rather, different factors performed better or worse depending on the economic regime.
Rising Growth and Rising Inflation: This most closely reflects our current economic regime. As noted above, momentum has historically performed the best during such periods, with an annualized return of 35.4% versus 20.0% for the S&P 500.
Rising Growth and Falling Inflation: Both the S&P 500 Pure Growth index and the S&P 500 Pure Value index have led when economic growth is rising but inflation is falling. During this type of regime, they realized annualized returns of 35.3% and 34.3%, respectively, versus 27.4% for the S&P 500. Economic expansion combined with slowing price increases boosts profits. These indexes are tracked by Invesco S&P 500 Pure Growth ETF
(RPG) and Invesco S&P 500 Pure Value ETF
(RPV).
Falling Growth and Falling Inflation: The S&P 500 Low Volatility index has fared well when both economic growth and inflation are slowing. During such periods, the index has realized an annualized return of 8.9%, versus 3.0% for the S&P 500, due to its defensive characteristics. The S&P 500 Low Volatility targets stocks that experience smaller price movements. These tend to be stable companies that are less economically sensitive. The index is tracked by Invesco S&P 500 index Low Volatility ETF
(SPLV). Quality has also fared well in this type of environment.
Falling Growth and Rising Inflation: This is the worst type of environment for investors, and for consumers too. Low volatility’s defensive characteristics have enabled it to be the only factor of the seven analyzed here to have a positive annualized return for this regime. The S&P 500 Low Volatility returned 4.3%, versus –10.1% for the S&P 500.
It is worth noting that quality never ranked last or next to last in terms of performance across any regime. This supports the notion of seeking fundamentally sound companies regardless of the current economic regime. Quality also pairs well with other factors, including value, growth, size and momentum. All AAII model portfolios incorporate a quality element in their rules.
In terms of factors, there is an argument for diversification, as no single factor outperforms all the time. All the factors mentioned here can be used alongside a broad market index fund—such as one tracking the S&P 500—if you prefer to tilt toward a specific factor rather than fully committing to it.

More on AAII.com
Using Momentum to Spot Outperforming Stocks
The just-released October 2026 AAII Journal shows where to find momentum data on the AAII website and how to incorporate momentum into your investing strategy.An Opportunistic, and Disciplined, Approach to Small-Cap Investing
Inside tips from a fund manager on finding good companies trading at reasonable valuations that can be owned for the long term.The Eight Metrics AAII Uses to Identify Quality Stocks
AAII’s A+ Quality Grade encompasses a comprehensive set of financial indicators to identify high-quality stocks.
AAII Sentiment Survey
Optimism among individual investors about the short-term outlook for stocks increased in the latest AAII Sentiment Survey. Meanwhile, neutral sentiment and pessimism decreased.
Bullish sentiment, expectations that stock prices will rise over the next six months, increased 2.0 percentage points to 34.6%. Bullish sentiment is below its historical average of 37.5% for the ninth time in 11 weeks.
Neutral sentiment, expectations that stock prices will stay essentially unchanged over the next six months, decreased 0.4 percentage points to 18.9%. Neutral sentiment is unusually low and is below its historical average of 31.0% for the 30th consecutive week.
Bearish sentiment, expectations that stock prices will fall over the next six months, decreased 1.6 percentage points to 46.5%. Bearish sentiment is unusually high and is above its historical average of 31.5% for the 34th consecutive week.
The bull-bear spread (bullish minus bearish sentiment) increased 3.5 percentage points to –11.8%. The bull-bear spread is below its historical average of 6.5% for the 11th consecutive week.
This week’s special question asked AAII members how they believe the November midterm elections will impact stock prices.
Here is how they responded:
I don’t expect a meaningful impact: 32.1%
It depends on which party wins control of Congress: 28.2%
The outcome will likely be bullish for stocks: 17.6%
The outcome will likely be bearish for stocks: 15.3%
Not sure/no opinion: 6.9%
This week’s Sentiment Survey results:
Bullish: 34.6%, up 2.0 points
Neutral: 18.9%, down 0.4 points
Bearish: 46.5%, down 1.6 points
Historical averages:
Bullish: 37.5%
Neutral: 31.0%
Bearish: 31.5%
See more Sentiment Survey results.

AAII Asset Allocation Survey
Individual investors’ allocations to cash decreased while stock and bond allocations increased in the September AAII Asset Allocation Survey.
Stock and stock fund allocations increased 0.7 percentage points to 71.8%. Stock and stock fund allocations are above their historical average of 61.5% for the 76th consecutive month.
Bond and bond fund allocations increased 0.3 percentage points to 14.9%. Bond and bond fund allocations are below their historical average of 16.0% for the seventh consecutive month.
Cash allocations decreased 1.0 percentage points to 13.3%. Cash allocations are below their historical average of 22.5% for the 46th consecutive month.
September AAII Asset Allocation Survey results:
Stocks and Stock Funds: 71.8%, up 0.7 percentage points
Bonds and Bond Funds: 14.9%, up 0.2 percentage points
Cash: 13.3%, down 1.0 percentage points
September AAII Asset Allocation Details:
Stocks: 33.4%, down 0.0 percentage points
Stocks Funds: 38.3%, up 0.7 percentage points
Bonds: 5.7%, up 0.6 percentage points
Bond Funds: 9.1%, down 0.4 percentage points
Historical averages:
Stocks/Stock Funds: 62.0%
Bonds/Bond Funds: 16.0%
Cash: 22.0%