
What's Driving 2026 Stock Market Rotation by Size and Sector

Beyond the headline volatility, we’ve seen ongoing rotation in the stock market since the Iran war began at the end of February. Outside of the energy sector, the stocks that led prior to the start of the war are largely not the ones that have led since. An additional shift occurred this week following the Tuesday, April 7, two-week ceasefire agreement.
Tables are worth a thousand words, so this week, I share two sets of tables with you. Using index exchange-traded funds (ETFs), one set shows the rotation among stocks of different sizes and styles. The other shows the rotation of stocks by sectors.
Mid- and Small-Caps Plus Energy Led Before the Iran War
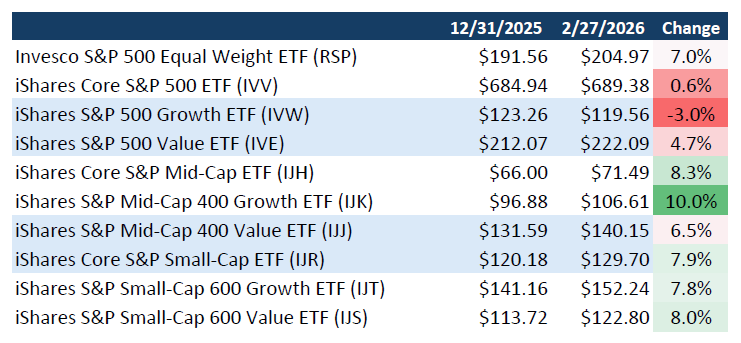
Mid- and small-cap stocks were the winning combination during the first two months of the year. Through February 27, iShares S&P Mid-Cap 400 Growth ETF (IJK) realized a 10.0% gain, versus a mere 0.6% return for iShares Core S&P 500 ETF (IVV). Small-cap stocks also did well, particularly iShares S&P Small-Cap 600 Value ETF (IJS). Small-cap value stocks were, and continue to be, historically undervalued relative to their large-cap peers.
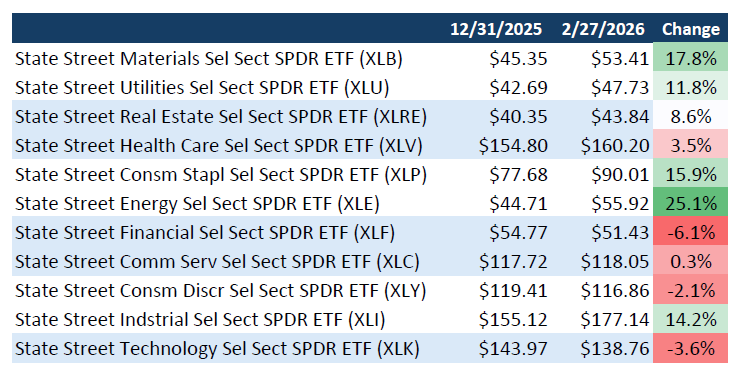
(The green shading in the tables below highlights the best-performing ETFs. The red shading highlights the worst-performing ETFs.)
Oil prices rose about $10 (16.7%) to $67.02 per barrel in the two months before the Iran war started. State Street Energy Select Sector SPDR ETF (XLE) climbed steadily during January and February as higher oil prices boosted expectations for oil companies’ profits.
State Street Materials Select Sector SPDR ETF (XLB) and State Street Consumer Staples Select Sector SPDR ETF (XLP) also fared well. The former ETF benefited from an anticipated rise in commodity costs. The latter ETF rose as investors rotated away from more volatile stocks.
Wartime: Equal Weight Gives Back Gains While Oil Spikes
This wartime period ran from the start of the bombing of Iran through this past Tuesday, the last trading session before the ceasefire was announced.
The most notable shift from the pre-war period is the underperformance of Invesco S&P 500 Equal Weight ETF (RSP). This ETF equally weights all S&P 500 index stocks. It fell 5.6% during the wartime period as investors shifted their preferences away from large-cap value and toward large-cap growth. The change benefited the largest stocks within the S&P 500 and generally hurt mid-sized and smaller stocks within the index.
Notably, small-cap stocks held up better than their larger-cap counterparts. Smaller companies tend to be more domestically focused, which may have helped support their performance.
State Street Energy Select Sector SPDR gained an additional 7.6% during the war, bringing its 2026 gain up to 34.6% before Tuesday’s ceasefire. The jump reflected the spike in oil prices caused by the blockade of the Strait of Hormuz. Crude oil prices reached a closing high of $112.95 per barrel on Tuesday.
The consumer staples sector, which fared well in the pre-war period, more than gave back its 2026 gains during the war. This drop occurred as investors rotated into more volatile growth stocks.
Growth Jumps Following the Ceasefire Announcement
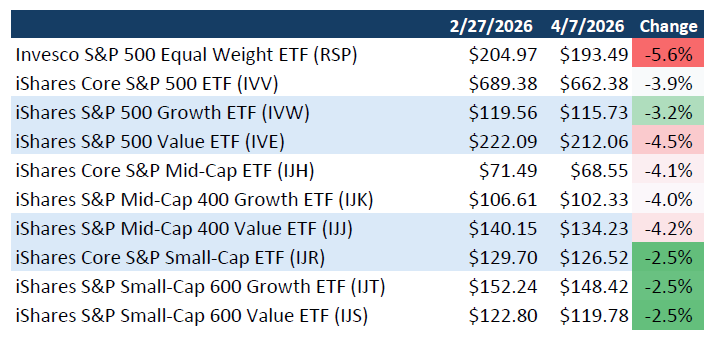
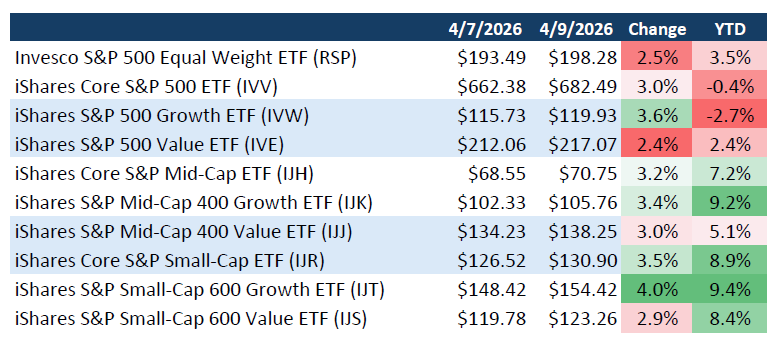
The final two tables below show returns from the close on Tuesday, April 7, 2026, through this afternoon. This is admittedly a very short period.
Growth stocks experienced the most positive reaction following the ceasefire announcement. Over the short period, iShares S&P Small-Cap 600 Growth ETF (IJT) jumped 4.0%, iShares S&P 500 Growth ETF (IVW) was up 3.6% and iShares S&P Mid-Cap 400 Growth rose 3.4%.
The rotation into growth occurred at the expense of value stocks. iShares S&P 500 Value ETF (IVE) lagged the most, up just 2.4%. Its comparatively lackluster gain helps explain why the Invesco S&P 500 Equal Weight also trailed most ETFs in the table below.
Year to date, iShares S&P Small-Cap 600 Growth is the big winner, up 9.4%. Valuations for small-cap growth stocks are lower than they are for large-cap growth stocks. Mid-cap growth stocks, which rank second in year-to-date performance, were the best performers prior to the start of the Iran war.
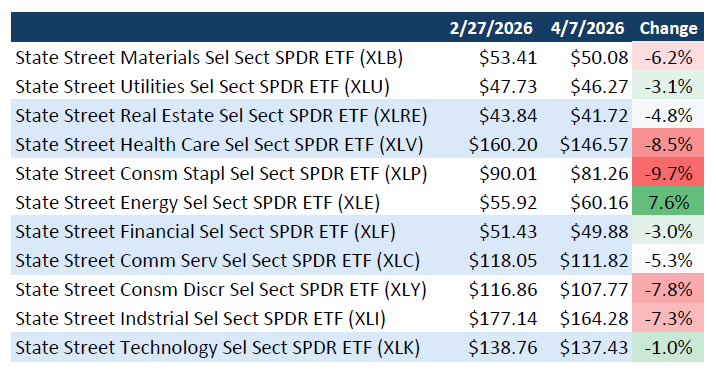
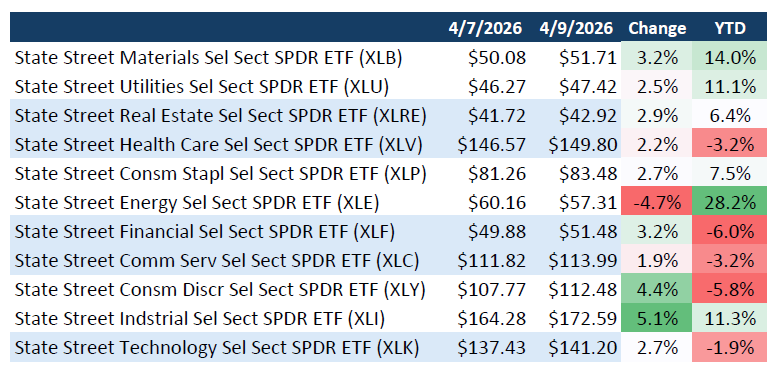
State Street Industrial Select Sector SPDR ETF (XLI) is up 5.1% since the ceasefire announcement as of this morning. Following it in sector leadership is State Street Consumer Discretionary Select Sector SPDR ETF (XLY). Their outperformance likely reflects expectations for the economy to hold up better than recently feared.
The energy sector remains the clear winner year to date. State Street Energy Select Sector SPDR is up 28.2%. Oil prices rebounded this morning after dropping yesterday.
Benjamin Graham famously described the stock market as a voting machine in the short term. This is what we are currently seeing here.
The data is interesting and helps to explain what has boosted or hurt your portfolio this year. The returns shown here also reflect the short-term moves made in reaction to the headlines about the Iran war. While peace and an Iranian government that is not aggressive toward its neighbors or citizens are desired, attempting to invest based on the geopolitical headlines is speculation.
The volatility we’ve seen so far this year is part of the price long-term investors pay to realize good long-term returns. If stocks were not volatile, then their long-term returns would be lower.
AAII Stock Bracket Challenge
The Quarterfinal round of the AAII Stock Bracket Challenge is in the books, and the results reflect the market’s recent shift toward growth stocks. Several higher-seeded companies advanced, though not without some closely contested matchups.
The Semifinal matchups are: Apple Inc. (AAPL) versus JPMorgan Chase & Co. (JPM), and Alphabet Inc. (GOOGL) versus Coca-Cola Co. (KO).
As in the first round, short-term market trends played a key role in the Quarterfinal round, as did company- and sector-specific headlines. Apple and Alphabet benefited from growth’s success, while an earnings warning by Pfizer Inc. (PFE) allowed Coca-Cola to refreshingly move on.
None of our contestants have a perfect bracket anymore. Four contestants have 10 correct picks. EDS 10picks has moved ahead of Phred in GA. Dave’s EZ pick is in third place, with JScott looking to break into the top three.
This is turning into quite an exciting contest.
The Semifinal round is running from April 8–14, ending at market close on Tuesday, April 14. Check your bracket, track live results and follow the leaderboard here.
Join us for our Week 3 live stream on Wednesday, April 15, at 1:00 p.m. Central Time for a full breakdown of the Semifinal results. We’ll also highlight some hidden gems on AAII.com that will help you analyze your favorite stocks—and the ones that could become your new favorites.

More on AAII.com
Revisiting the Use of ETFs to Construct an S&P 500 Portfolio
Comparing the performance of an equally weighted sector portfolio against an S&P 500 index fund over a 20-year period.The Four Asset Classes With Great Long-Term Performance
If you apply the lessons of the past 90 years, it’s reasonable to expect favorable returns from following simple strategies that combine a few key asset classes.Equal Weighting Across Market-Cap Sizes Beats a Total Market Fund
The April 2026 AAII Journal shows how the growth of a $10,000 portfolio equally weighted between large, mid-size and small stock funds was more than $3,000 higher than that of a total stock market index fund over 25 years.AAII Sentiment Survey
Pessimism among individual investors about the short-term outlook for stocks decreased in the latest AAII Sentiment Survey. Meanwhile, optimism and neutral sentiment increased.
Bullish sentiment, expectations that stock prices will rise over the next six months, increased 2.2 percentage points to 35.7%. Bullish sentiment is below its historical average of 37.5% for the eighth consecutive week.
Neutral sentiment, expectations that stock prices will stay essentially unchanged over the next six months, increased 6.3 percentage points to 21.3%. Neutral sentiment is unusually low and is below its historical average of 31.5% for the 90th time in 92 weeks.
Bearish sentiment, expectations that stock prices will fall over the next six months, decreased 8.4 percentage points to 43.0%. Bearish sentiment is unusually high and is above its historical average of 31.0% for the ninth consecutive week.
The bull-bear spread (bullish minus bearish sentiment) increased 10.6 percentage points to –7.2%. The bull-bear spread is below its historical average of 6.5% for the ninth consecutive week.
This week’s special question asked AAII members what changes, if any, they’ve made to their portfolio since the start of the Iran war.
Here is how they responded:
I have not made any changes (maintained existing positions): 42.3%
I have added to existing positions or bought new ones at lower prices: 24.9%
I have reduced equity exposure (sold stocks or funds, raised cash): 14.8%
I have made other adjustments (e.g., rebalanced, increased bond or commodity allocation): 10.6%
I have shifted holdings toward defensive sectors (e.g., energy, defense, utilities): 7.4%
This week’s Sentiment Survey results:
Bullish: 35.7%, up 2.2 points
Neutral: 21.3%, up 6.3 points
Bearish: 43.0%, down 8.4 points
Historical averages:
Bullish: 37.5%
Neutral: 31.5%
Bearish: 31.0%
See more Sentiment Survey results.