
What Makes Perpetual Futures So Risky?

A new type of financial instrument has become available in the U.S.: perpetual futures, also known as perpetuals, or perps. As the name suggests, perpetuals never expire. Prediction market Kalshi and cryptocurrency exchange Coinbase both offer these contracts in the U.S.
Many of you reading this likely will not trade perpetuals, but someone you know might. It is worth being familiar with them so you can explain the risks.
Currently, perpetuals only track the price of cryptocurrency in the U.S. Proponents of perpetuals are pushing to make them available for energy commodities as well. The U.S. Commodities and Futures Trading Commission (CFTC) is seeking public comments on this, as well as on the 24/7 trading of energy futures contracts. Instructions on how to comment are available in the June 25, 2026, issue of the Federal Register.
Traditional futures contracts track the prices of certain cryptocurrencies, plus commodities, traditional currencies and financial instruments. Futures contracts, importantly, have preset expiration dates. Futures contracts expire on either a daily, monthly or quarterly basis. At expiration, the contract is settled with the delivery of cash or the underlying asset (e.g., oil).
Many traders exit their futures contracts before expiration to avoid settlement. A gain or loss is realized at the time the contract is exited, depending on the purchase price and the price movement of the underlying asset or financial instrument.
Various businesses use futures contracts to hedge against a change in prices. A farmer, for instance, may use futures contracts to lock in a set price for their crops. Transportation companies may use futures contracts to protect against rising fuel prices. Businesses with overseas operations may use currency futures contracts to hedge against exchange rate moves.
While perpetuals can be used for hedging a position in cryptocurrency that you own or would buy at a certain price, they are pitched to those who wish to speculate. Kalshi and Coinbase describe them as a way to trade cryptocurrencies without owning the underlying asset.
There is no delivery since perpetuals never expire. A trader realizes a gain if the contract rises in value after purchase, and they realize a loss if the contract falls in value.
Money can also be gained or lost on perpetuals through funding costs. Funding costs are mechanisms used to keep the price of the perpetual in line with the price of the underlying asset.
How Kalshi’s Funding Rate for Perpetuals Works
Source: Kalshi,
https://kalshi.com
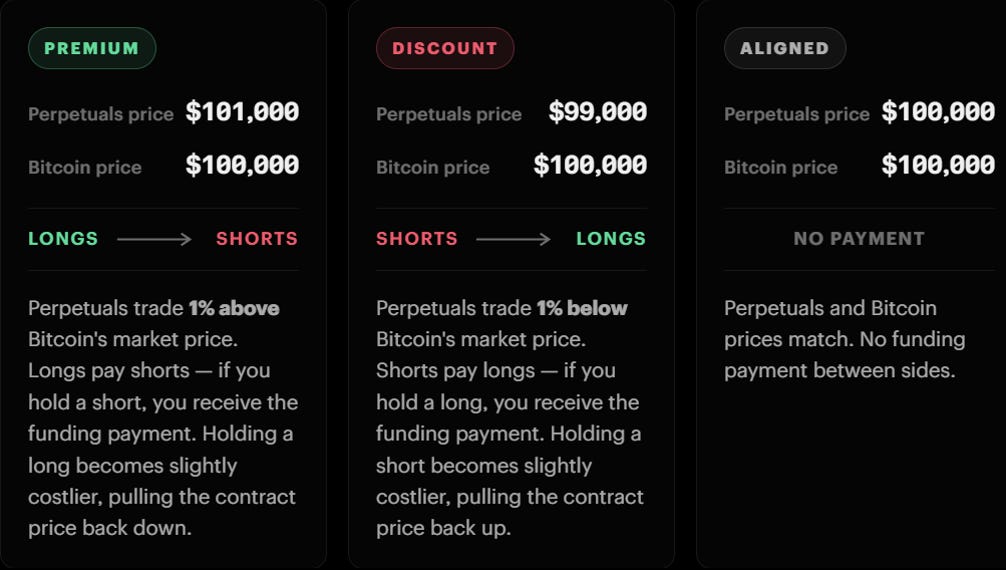
The figure above provides an example from Kalshi. Let’s say that bitcoin is trading at $100,000 but perpetuals are trading at $101,000. Those who are long the perpetual (betting that bitcoin’s price will rise) would pay those who are short (betting that it will fall). A sustained 1% premium like this on Kalshi produces a 1% funding rate. So, a $10,000 long position would pay $100 to the short side every eight hours, and a $100,000 long position would pay $1,000. If the perpetual’s price is instead $99,000, shorts would pay longs.
Coinbase applies funding every hour using its own rate formula. Over time, the funding rate can create losses even if the price of the underlying asset is stable.
The magnitude of potential gains or losses is amplified by margin.
Coinbase, which provides access to global perpetuals, allows leverage of up to 10x on cryptocurrency (e.g., $1,000 of perpetuals for every $100 of assets in your account) in the U.S. A page on the “Learn” section of Coinbase’s website lists a cap of up to 100x leverage, but it does not share further details. Kalshi caps bitcoin leverage at 6x (e.g., $600 of perpetuals for every $60 of assets). Both Coinbase and Kalshi will close your position if your maintenance margin becomes too small.
To compound matters, the perpetuals market is open 24 hours, like the cryptocurrency markets. This has the potential to lead to big overnight moves. It also increases the potential for funding rates to be applied more due to periods with lighter trading volume.
The combination of volatile price movement and funding costs increases the odds of this occurring, especially for those not constantly monitoring their accounts. The closing of the position in this instance would likely lock in a loss.
Margin is frequently used to trade futures contracts. When it is, a margin maintenance account is required. Should a futures contract move enough in price to make the account insufficiently funded, a margin call would occur. These calls typically occur at the end of the day, though they can occur on an intraday basis if there is enough volatility. Futures contracts, unlike perpetuals, do not trade on a 24/7 basis.
Proponents of perpetuals say that these contracts allow long-term holders of cryptocurrencies to hedge their positions. While this is true, Kalshi and Coinbase both describe perpetuals as allowing people to trade the price of cryptocurrencies “without ever owning them.” Moreover, the combination of volatility, funding costs and 24/7 trading makes it too easy to lose money. Taken together, perpetuals look more like a gambling instrument than a financial instrument.

More on AAII.com
Bitcoin and Beyond: Your Options for Investing in Crypto
The world of cryptocurrency continues to evolve as it garners mainstream acceptance from governments, traditional financial institutions and investors.Navigating the Rise of Prediction Markets
Participating in prediction markets should be regarded as speculative due to their binary outcomes, novel nature, evolving regulation, relatively high costs and low liquidity.Economic Moats: The Engine Behind Long-Term Earnings Power
The June 2026 AAII Journal discusses why sustainable value creation requires a competitive advantage that has both magnitude and duration.
AAII Sentiment Survey
Optimism among individual investors about the short-term outlook for stocks increased in the latest AAII Sentiment Survey. Meanwhile, neutral sentiment and pessimism decreased.
Bullish sentiment, expectations that stock prices will rise over the next six months, increased 8.4 percentage points to 44.9%. Bullish sentiment is above its historical average of 37.5% for the first time in six weeks.
Neutral sentiment, expectations that stock prices will stay essentially unchanged over the next six months, decreased 5.1 percentage points to 18.9%. Neutral sentiment is unusually low and is below its historical average of 31.5% for the 101st time in 103 weeks.
Bearish sentiment, expectations that stock prices will fall over the next six months, decreased 3.2 percentage points to 36.1%. Bearish sentiment is above its historical average of 31.0% for the 20th consecutive week.
The bull-bear spread (bullish minus bearish sentiment) increased 11.6 percentage points to 8.8%. The bull-bear spread is above its historical average of 6.5% for the second time in 20 weeks.
This week’s special question asked AAII members how the memorandum of understanding between the U.S. and Iran has influenced their economic expectations.
Here is how they responded:
Makes me more pessimistic: 31.2%
No impact/little impact: 34.4%
Makes me more optimistic: 27.4%
Not sure/no opinion: 7.0%
This week’s Sentiment Survey results:
Bullish: 44.9%, up 8.4 points
Neutral: 18.9%, down 5.1 points
Bearish: 36.1%, down 3.2 points
Historical averages:
Bullish: 37.5%
Neutral: 31.5%
Bearish: 31.0%
See more Sentiment Survey results.

AAII Asset Allocation Survey
Individual investors’ allocations to stocks increased while bond and cash allocations decreased in the May AAII Asset Allocation Survey.
Stock and stock fund allocations increased 1.3 percentage points to 69.8%. Stock and stock fund allocations are above their historical average of 61.5% for the 72nd consecutive month.
Bond and bond fund allocations decreased 0.7 percentage points to 14.9%. Bond and bond fund allocations are below their historical average of 16.0% for the seventh time in eight months.
Cash allocations decreased 0.6 percentage points to 15.3%. Cash allocations are below their historical average of 22.5% for the 42nd consecutive month.
May AAII Asset Allocation Survey results:
Stocks and Stock Funds: 69.8%, up 1.3 percentage points
Bonds and Bond Funds: 14.9%, down 0.7 percentage points
Cash: 15.3%, down 0.6 percentage points
May AAII Asset Allocation Details:
Stocks: 32.0%, up 2.4 percentage points
Stocks Funds: 37.8%, down 1.2 percentage points
Bonds: 4.0%, down 0.6 percentage points
Bond Funds: 11.0%, down 0.0 percentage points
Historical averages:
Stocks/Stock Funds: 61.5%
Bonds/Bond Funds: 16.0%
Cash: 22.5%
Take the Asset Allocation Survey.