


This week, we cover AAII’s strategy that focuses on firms with a low price-to-sales (P/S) ratio relative to their historical average. Since inception in 1998, our Price-to-Sales screening model has an average annual price gain of 13.2%, versus the S&P 500 index’s 7.5% gain over the same period. Read on to find out how we put this screen together.
The Case for Revenue-Based Valuations
Screening for undervalued stocks based on the price-to-sales ratio (current price divided by the sales per share for the most recent 12 months) is not a new concept. The technique was originally popularized by Kenneth Fisher in the first edition of his book “Super Stocks” (Irwin Professional Publishing, 1984).
Revenue-based valuations are considered among the “cleanest” of all valuation methodologies. Revenues, or sales, are less impacted than earnings or book value by accounting decisions made by management and the corporate financial structure.
Sales levels tend to be more comparable across different firms—leading to a valuation tool that is more comparable from firm to firm within the same industry. Asset-based models such as low price-to-book-value (P/B) screens can be influenced by company factors such as specific depreciation schedules, age of assets and even inventory accounting methods. The market may not be able to properly adjust for these company-specific factors, which leads to mispriced securities.
There are two other big reasons revenue-based valuation methodologies have a following. First, they are among the least likely of all valuation measures to have a negative or otherwise unusable value. A temporary loss will make earnings-based valuation ratios meaningless. Second, revenue-based valuation measures tend to be less volatile than earnings-based valuation measures.
While the price-earnings (P/E) ratio, and versions of it, is the most popular valuation measure, revenue-based valuation methodologies should not be overlooked as a tool for assessing whether a company is inexpensive, fairly priced or expensive. Because these measures are less commonly used, they may lead you to stocks whose bargain valuations have not been uncovered by other investors.
Ranges for the Price-to-Sales Ratio
Investors normally seek out stocks with low valuation measures, such as the price-to-sales or price-earnings ratios, with the belief that the market may have overlooked a company or incorrectly assessed its value.
Stocks with low valuation levels may already be beaten down, so any good news can translate into higher stock prices. However, some industries traditionally sell with low price-to-sales ratios. Companies in these industries, such as supermarkets or firms with very poor sales growth prospects, typically have low profit margins (income divided by sales). A simple screen for just a low price-to-sales ratio will tend to turn up many of these firms. That is why we focus on companies with current price-to-sales ratios below their historical average and below the norm for their industry.
Price-to-sales levels are tied to expectations of future company growth, profitability and risk. The higher the expected growth, the higher the price-to-sales ratio that a stock can support. Higher profit margins also translate into high price-to-sales ratios. Profit margins measure the level of income produced for a given level of sales. Profits point to the company’s long-term growth and staying power.
Developing the Primary Price-to-Sales Filters
Price-to-sales ratios do not generally work very well with companies such as banks, real estate investment trusts (REITs) or other firms where ongoing sales are not a key driving force. Therefore, our first criteria exclude financial firms and REITs.
With banks and REITs excluded, we are left with the question of establishing an appropriate cutoff level for the price-to-sales ratio. Firms with low price-to-sales ratios are thought to be good prospects for future share price increases. With low price-to-sales stocks already beaten down, any good news can translate into higher stock prices.
As mentioned, some industries traditionally sell with low price-to-sales ratios. To help take industry factors into account, our filter looks for companies whose price-to-sales ratios are below the median for their industry.
Another approach for judging the relative level of the company’s price-to-sales ratio is to compare it against the historical levels for the firm. A ratio lower than its historical average would be a sign that the stock is potentially undervalued, while a ratio that is high compared to its historical average might indicate an overvalued firm. This approach assumes that the underlying growth and profit prospects of the firm have not changed drastically. Comparing a firm against its own average alleviates the problem of finding the correct fit in terms of industry group. Another advantage of this type of analysis is that it will not automatically rule out high-growth companies in high-growth industries as an absolute price-to-sales ratio will. The companies are ranked by how their current ratio compares to their average ratio over the last five years.
Members are looking for your input. Can you help with this question from the Stock Screening & Analysis Community?
Do you use the price-to-sales (P/S) ratio to identify potentially undervalued stocks? Why or why not?
Click here and then choose the Join Community button on the right to answer this question or read their responses.
Conditioning Criteria
Even a stock with a low price-to-sales ratio is no bargain if it has no sales and earnings growth prospects. If a company has poor prospects, then it should trade with a low ratio. Optimally, an investor is looking for a growth company that has stumbled due to a temporary factor or a neglected company yet to attract the attention of Wall Street. The next criterion requires that the company have a growth rate in sales over the last five years greater than its industry median—identifying companies that have expanded their sales levels more quickly than other firms in their industry, yet that are trading at a discount to the industry norm.
A screening criterion using just growth rates can mask a great deal of variability. A close examination of the year-to-year figures, recent quarterly trends in sales and future prospects in sales growth should be part of the detailed analysis performed on the companies passing the screen. The other consideration is that an investor’s analysis must be looking forward to the firm’s future prospects.
Financial Leverage
A value screen for downtrodden stocks will reveal firms that might be somewhat troubled. As a safety hedge, many investors include a screen that establishes a maximum level of financial leverage. While the use of debt can help boost the return on equity (ROE) when the company is performing strongly, it can also saddle the company with interest payments that must be made throughout the business cycle, thereby slowing return on equity when business slows down and increasing the risk that the company may not be able to meet its interest payments.
Basic leverage screens look at factors such as debt relative to equity or liabilities relative to assets. Companies in more stable industries can safely assume greater levels of debt. The companies are screened for liabilities-to-assets ratios lower than their industry median. While leverage screens do not tend to turn up promising investments, they are helpful in highlighting troubled firms, especially if studied over time.
Relative Price Strength
Value screens often turn up firms that require patience from the investor waiting for the market to change its pessimistic view of the industry. A screen for high relative price strength can help to identify an improving stock outlook. A screen requiring a higher 52-week relative strength ratio than the industry median is specified. The relative strength ratio compares the company’s price performance to that of the S&P 500. Firms with positive relative strength ratios outperformed the S&P 500, while negative ratios reflect relative underperformance.
Firm Size
As companies get larger, their price-to-sales ratios normally get smaller. Once a firm reaches a large scale, it becomes increasingly difficult for it to sustain above-average growth rates. Lower price-to-sales ratios come with these lower prospects. At the other end of the scale, very small, high-growth firms in developing markets are difficult to incorporate into a value screen. These micro-cap stocks are also very illiquid stocks that carry high transaction costs. To exclude the very small end of the market, a minimum market capitalization of $50 million is specified as the final screen. As is true for any screen, the list of passing companies represents a crude starting point for further in-depth analysis.
Final Thoughts on the Price-to-Sales Approach
The price-to-sales ratio holds promise as a screening approach. It may identify undervalued firms sooner than the price-earnings approach and avoid some of the accounting complications of the price-earnings and price-to-book screens. But industry knowledge is crucial in judging price-to-sales ratios. Screens for low price-to-sales firms tend to be more industry-specific than price-earnings ratio screens.
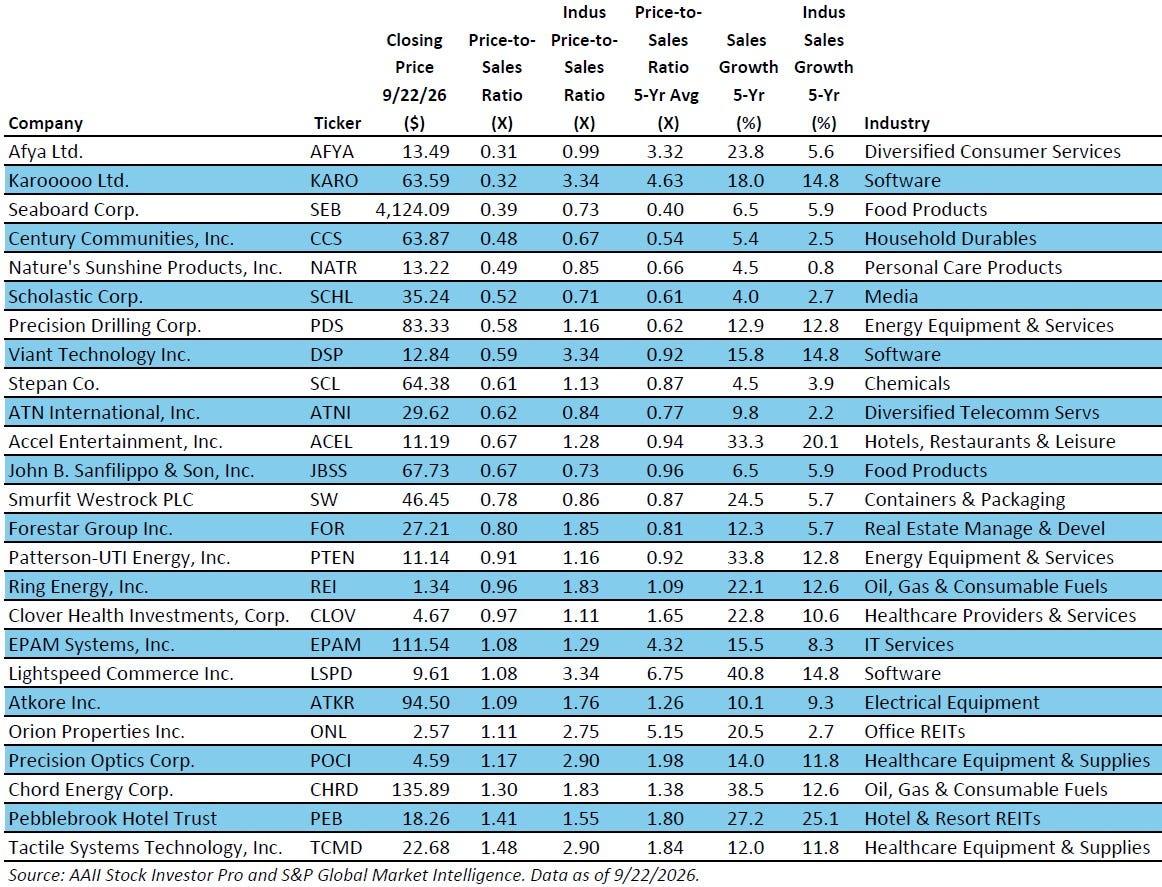
25 Stocks Passing the Price-to-Sales Screen (Ranked by Price-to-Sales Ratio)
____
Keep in mind that no matter how well a stock screening methodology has performed (or how badly it has underperformed) over the long term, stock screening is only the first step in the stock selection process. You will want to do your homework to see why these companies are at their current levels. Only then will you gain insight into those that will continue to languish and those that may eventually flourish.
The stocks meeting the criteria of the approach do not represent a “recommended” or “buy” list. It is important to perform due diligence to verify the financial strength of the passing companies and to identify those stocks that match your investing tolerances and constraints before committing your investment dollars. Keep in mind that the quantitative screens AAII has developed are based upon our interpretations of published works tied to the market gurus.