
Three Ways to Diversify From a Top-Heavy S&P 500

Note: My six-week Income Investing Seminar is ongoing, but it’s not too late to register. I covered dividends this week and will move on to bonds, income diversifiers and retirement tax strategy in the upcoming weeks. For only $199, you get live access to all six sessions, plus lifetime access to all recordings and materials. Join us.
Concentration in the S&P 500 index is back near its highest level in decades. As of the close on Tuesday, June 9, 2026, the index’s 10 largest constituents by market capitalization comprised 41.5% of its total market cap.
Those companies, from largest to smallest, are: Nvidia Corp. (NVDA), Apple Inc. (AAPL), Alphabet Inc. (GOOGL), Alphabet Inc. (GOOG), Microsoft Corp. (MSFT), Amazon.com Inc. (AMZN), Broadcom Inc. (AVGO), Tesla Inc. (TSLA), Meta Platforms Inc. (META) and Micron Technology Inc. (MU). Eight of these 10 constituents are in the information technology or communication services sectors. Amazon and Tesla, which have aspects of a technology company, belong to the consumer discretionary sector. (S&P Dow Jones Indices lists the two Alphabet share classes as separate constituents.
This high level of concentration continues to drive the S&P 500’s performance. It also distorts how the index and its typical constituent are performing. This becomes obvious when we compare iShares Core S&P 500 ETF (IVV) to Invesco S&P 500 Equal Weight ETF (RSP). The two exchange-traded funds (ETFs) hold the same stocks but allocate their portfolios differently. The latter, as its name implies, rebalances quarterly to weight each of the S&P 500’s stocks equally.
Over the past three months, iShares Core S&P 500 has outperformed Invesco S&P 500 Equal Weight by 2.2 percentage points (9.4% versus 7.2%).
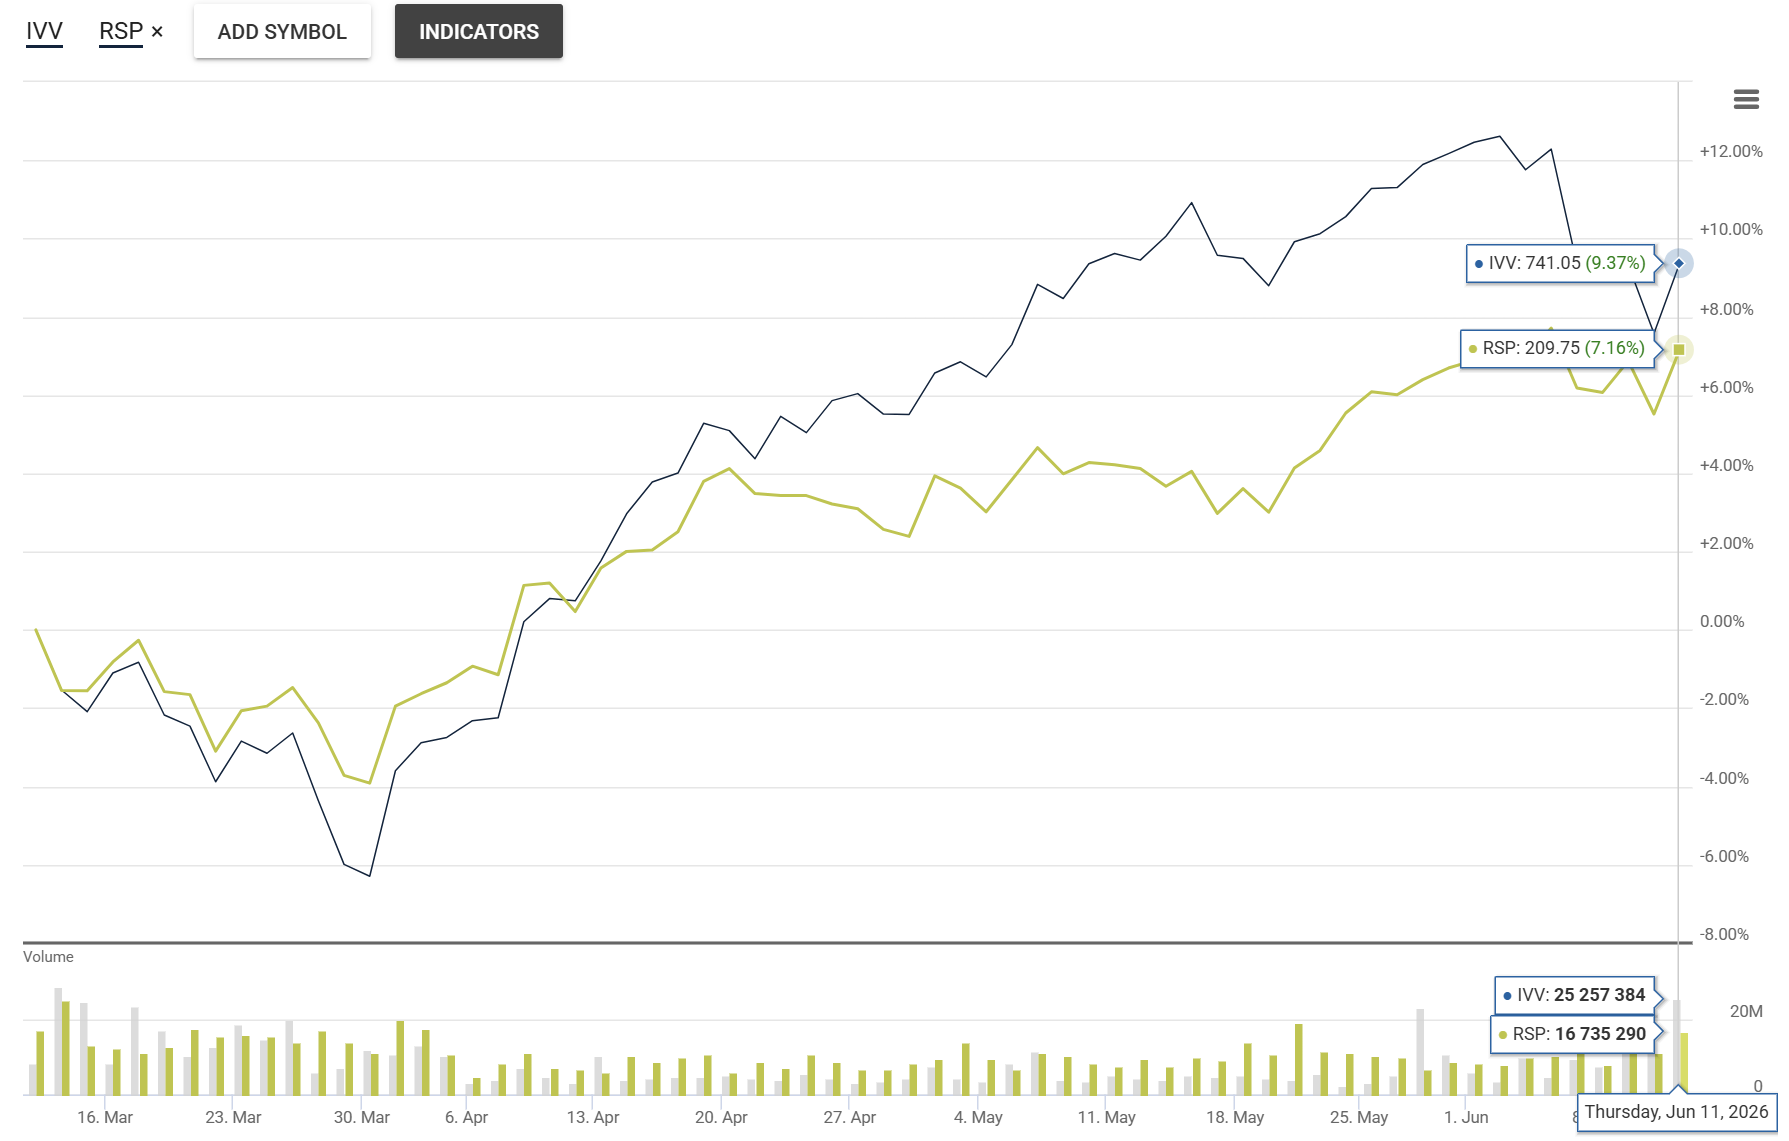
Source: AAII.com and QuoteMedia. Data as of 6/11/2026.
The differences go well beyond performance. The median price-earnings (P/E) ratio for the 10 largest S&P 500 constituents is higher than the median price-earnings ratio for all other S&P 500 constituents on a trailing and forward basis.
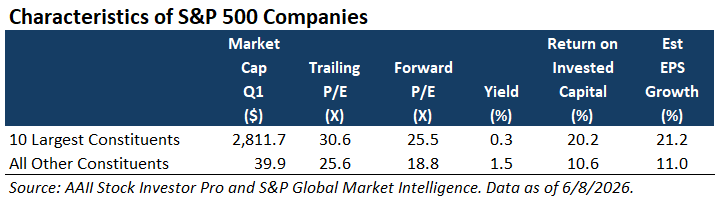
The median dividend yield for the 10 largest constituents is lower than that of the other S&P 500 stocks. The 10 largest constituents’ median return on invested capital (ROIC), which factors in both equity and debt, is significantly stronger than that of the other S&P 500 stocks. The median future five-year earnings growth rate projected by analysts for the 10 largest constituents is nearly double the median projected growth rate for all the other S&P 500 constituents.
These numbers are not surprising given the types of companies leading the S&P 500. How you perceive these numbers depends on the type of strategy you follow. Growth investors might view the higher valuations as acceptable given the stronger growth rates and larger returns on invested capital. Value investors will scoff at the price-earnings ratios, while income-seeking investors will view the median yield paid by the biggest stocks as paltry.
If you are concerned about the high level of concentration in the S&P 500, there are a few things you can do.
Change how you allocate to large-cap stocks. Seek large-cap ETFs or mutual funds that are focused on value or dividends, such as iShares MSCI USA Value Factor ETF (VLUE) or Vanguard High Dividend Yield ETF (VYM). MSCI USA Value Factor has very strong A+ Investor Grades for its one-, three- and five-year performance. Vanguard High Dividend Yield has performed well compared to other large dividend ETFs. Other options include the previously mentioned Invesco S&P 500 Equal Weight and other funds that do not weight based on largest-to-smallest market cap. Note that large-cap momentum and high-beta ETFs currently overweight technology and technology-adjacent stocks.
Add exposure to small-cap stocks, or increase your current exposure. Small-cap stocks, especially small-cap value stocks, continue to trade at historically low valuations relative to large-cap stocks. Vanguard Russell 2000 Value ETF (VTWV) has A+ Investor Grades of A (very strong) or B (strong) for its one-, three- and five-year returns.
Go international. International stocks trade at lower valuations than their U.S. counterparts. Historically, international stocks have gone through periods of outperformance and underperformance relative to U.S. stocks. Currently, international stocks have endured an unusually long period of underperformance, which could set them up to outperform going forward. Schwab International Equity ETF (SCHF) has good A+ Investor Grades for its one-, three- and five-year returns.

More on AAII.com
Revisiting the Use of ETFs to Construct an S&P 500 Portfolio
Comparing the performance of an equally weighted sector portfolio against an S&P 500 index fund over a 20-year period.Freedom-Focused Emerging Markets Fund Taps Into Local Growth
Freedom weighting results in lower autocracy risk and more sustainable growth in emerging markets.Mapping the Safe Zone of Retirement Withdrawal Rates
The June 2026 AAII Journal includes an analysis of three retirement portfolios over 100 years that addresses the tension between portfolio longevity and lifestyle goals.
AAII Sentiment Survey
Pessimism among individual investors about the short-term outlook for stocks increased in the latest AAII Sentiment Survey. Meanwhile, optimism and neutral sentiment decreased.
Bullish sentiment, expectations that stock prices will rise over the next six months, decreased 5.9 percentage points to 30.4%. Bullish sentiment is below its historical average of 37.5% for the fourth consecutive week.
Neutral sentiment, expectations that stock prices will stay essentially unchanged over the next six months, decreased 4.8 percentage points to 22.0%. Neutral sentiment is unusually low and is below its historical average of 31.5% for the 99th time in 101 weeks.
Bearish sentiment, expectations that stock prices will fall over the next six months, increased 10.7 percentage points to 47.7%. Bearish sentiment is unusually high and is above its historical average of 31.0% for the 18th consecutive week.
The bull-bear spread (bullish minus bearish sentiment) decreased 16.6 percentage points to –17.3%. The bull-bear spread is unusually low for the first time since March and is below its historical average of 6.5% for the 17th time in 18 weeks.
This week’s special question asked AAII members if there is a bubble in stocks related to artificial intelligence (AI).
Here is how they responded:
Yes, there is a bubble in AI-related stocks: 36.3%
Some, but not all, AI-related stocks are too expensively valued: 51.5%
No, there isn’t a bubble in AI-related stocks: 7.4%
Not sure/no opinion: 4.9%
This week’s Sentiment Survey results:
Bullish: 30.4%, down 5.9 points
Neutral: 22.0%, down 4.8 points
Bearish: 47.7%, up 10.7 points
Historical averages:
Bullish: 37.5%
Neutral: 31.5%
Bearish: 31.0%
See more Sentiment Survey results.

AAII Asset Allocation Survey
Individual investors’ allocations to stocks increased while bond and cash allocations decreased in the May AAII Asset Allocation Survey.
Stock and stock fund allocations increased 1.3 percentage points to 69.8%. Stock and stock fund allocations are above their historical average of 61.5% for the 72nd consecutive month.
Bond and bond fund allocations decreased 0.7 percentage points to 14.9%. Bond and bond fund allocations are below their historical average of 16.0% for the seventh time in eight months.
Cash allocations decreased 0.6 percentage points to 15.3%. Cash allocations are below their historical average of 22.5% for the 42nd consecutive month.
May AAII Asset Allocation Survey results:
Stocks and Stock Funds: 69.8%, up 1.3 percentage points
Bonds and Bond Funds: 14.9%, down 0.7 percentage points
Cash: 15.3%, down 0.6 percentage points
May AAII Asset Allocation Details:
Stocks: 32.0%, up 2.4 percentage points
Stocks Funds: 37.8%, down 1.2 percentage points
Bonds: 4.0%, down 0.6 percentage points
Bond Funds: 11.0%, down 0.0 percentage points
Historical averages:
Stocks/Stock Funds: 61.5%
Bonds/Bond Funds: 16.0%
Cash: 22.5%