
Three Metals and Mining Stocks With Promising Cores
Gold prices above $4,000 boost metals stocks. See how Fortuna, Kinross and Newmont score using AAII’s A+ Investor Stock Grades.

This week, we use AAII’s A+ Investor Stock Grades to provide insight into three metals and mining stocks. With gold breaking above $4,000 per ounce and demand continuing to build, should you consider the three stocks of Fortuna Mining Corp. (FSM), Kinross Gold Corp. (KGC) and Newmont Corp. (NEM)?
Metals and Mining Stocks Recent News
Gold prices have broken above $4,000 per ounce in 2025, supported by inflation pressure and a shift toward safe-haven assets.
Inflows into gold-backed exchange-traded funds (ETFs) totaled $17.3 billion in September 2025, according to Forbes. Central banks have stepped up their gold purchases, and retail investors are turning to gold in response to global uncertainty. As a result, Goldman Sachs recently raised its gold forecast from $4,300 to $4,900 per ounce by year-end 2026, according to Reuters. Higher gold prices not only improve margins for mining companies but also encourage new exploration and production activity across the industry.
As momentum in the gold market continues, producers like Fortuna Mining, Kinross Gold and Newmont may stand to benefit. Their exposure to gold production positions them to potentially grow alongside the broader rally in precious metals.
Grading Metals and Mining Stocks With AAII’s A+ Stock Grades
When analyzing a company, it is helpful to have an objective framework that allows you to compare companies in the same way. This is why AAII created the A+ Stock Grades. They evaluate companies across five factors that research and real-world investment results indicate to identify market-beating stocks in the long run: value, growth, momentum, earnings estimate revisions (and surprises) and quality.
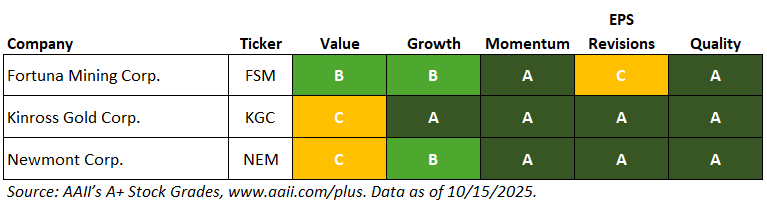
Using AAII’s A+ Stock Grades, the following table summarizes the attractiveness of three metals and mining stocks—Fortuna Mining, Kinross Gold and Newmont—based on their fundamentals.
AAII’s A+ Stock Grade Summary for Three Metals and Mining Stocks
What the A+ Stock Grades Reveal
Fortuna Mining Corp. (FSM) engages in the precious and base metals mining and related activities in Argentina, Burkina Faso, Côte d’Ivoire, Mexico, Peru and Senegal. The company operates through five segments: Mansfield, Sanu, Sango, Cuzcatlan and Bateas. It operates the Lindero, Yaramoko and Séguéla gold mines; the San Jose silver-gold mine; and the Caylloma silver, lead and zinc mine. Formerly known as Fortuna Silver Mines Inc., the company changed its name to Fortuna Mining Corp. in June 2024. Fortuna Mining was incorporated in 1990 and is based in Vancouver, Canada.
Fortuna Mining has a Quality Grade of A, based on a score of 92, which is very strong. Higher-quality stocks possess traits associated with upside potential and reduced downside risk. The Quality Grade is the percentile rank of the average of the percentile ranks of return on assets (ROA), return on invested capital (ROIC), gross income to assets, buyback yield, change in total liabilities to assets, accruals to assets, Z double prime bankruptcy risk (Z) score and F-Score. To be assigned a Quality Score, stocks must have a valid (non-null) measure and corresponding ranking for at least four of the eight quality measures.
The company ranks strongly in terms of its return on assets and F-Score. Its return on assets of 7.6% ranks in the 82nd percentile among all U.S.-listed stocks, and its F-Score of 7 ranks in the 84th percentile. The F-Score is a number between 0 and 9 that assesses the strength of a company’s financial position. It considers the profitability, leverage, liquidity and operating efficiency of a company. Fortuna Mining also has a Z-Score of 8.43, ranking in the 81st percentile.
The company’s Growth Grade is B, which is strong. The components of the Growth Composite Score consider a company’s success in growing sales on a year-over-year and long-term annualized basis and its ability to consistently generate positive cash from its core operations. Fortuna Mining has realized positive annual cash from operations in the past five consecutive years. It also has a five-year annualized sales growth rate of 32.8%.
Earnings estimate revisions indicate whether analysts’ expectations for the firm’s profits have improved or worsened. Fortuna Mining has an Earnings Estimate Revisions Grade of C, based on a score of 48, which is neutral. The grade is based on the statistical significance of its latest two quarterly earnings surprises and the increases in its consensus earnings estimate for the current fiscal year over the past month and past three months.
Fortuna Mining reported second-quarter 2025 earnings of $0.161 per share, compared to the consensus estimate of $0.182 per share, for a negative earnings surprise of 11.6%. Over the last month, the consensus earnings estimate for third-quarter 2025 has risen from $0.190 to $0.211 per share. For full-year 2025, the estimate has risen from $0.748 to $0.824 per share over the same period.
Kinross Gold Corp. (KGC), together with its subsidiaries, engages in the acquisition, exploration and development of gold properties principally in the U.S., Brazil, Chile, Canada and Mauritania. It is also involved in the extraction and processing of gold-containing ores; reclamation of gold mining properties; and production and sale of silver. Kinross Gold was founded in 1993 and is headquartered in Toronto, Canada.
Kinross Gold has a Value Grade of C, based on its Value Score of 47, which is average. Higher scores indicate a more attractive stock for value investors and, thus, a better grade. The Value Grade is the percentile rank of the average of the percentile ranks of the price-to-sales (P/S) ratio, price-earnings (P/E) ratio, price-to-book-value (P/B) ratio, price-to-free-cash-flow (P/FCF) ratio, shareholder yield and the ratio of enterprise value to earnings before interest, taxes, depreciation and amortization (EBITDA).
The company has a shareholder yield of 0.8%, ranking in the 38th percentile among all U.S.-listed stocks. Its price-to-free-cash-flow ratio is 17.5 and its price-earnings ratio is 20.5, ranking in the 44th and 52nd percentiles, respectively. The enterprise-value-to-EBITDA ratio is 6.2, ranking in the 15th percentile.
Kinross Gold has a Momentum Grade of A, based on its Momentum Score of 93. This means that the stock’s momentum is very strong in terms of its weighted relative price strength over the last four quarters. The weighted four-quarter relative strength rank is the relative price change for each of the past four quarters, with the most recent quarterly price change given a weight of 40% and each of the three previous quarters given a weight of 20%. The ranks are 93, 38, 96 and 72, sequentially from the most recent quarter, with higher ranks signaling stronger price momentum. The weighted four-quarter relative price strength is 32.0%.
Kinross Gold has a Growth Grade of A, which is very strong. The company has a five-year annualized sales growth rate of 8.0% and has generated positive annual cash from operations in the past five consecutive years.
Newmont Corp. (NEM) engages in the production and exploration of gold properties. It also explores for copper, silver, zinc, lead and other metals. The company has operations and/or assets in the U.S. and internationally. Newmont was founded in 1916 and is headquartered in Denver, Colorado.
Newmont has a Quality Grade of A, based on a score of 96, which is very strong. The company ranks strongly in terms of its return on assets and buyback yield. Its return on assets of 11.3% ranks in the 90th percentile among all U.S.-listed stocks, and its buyback yield of 3.7% ranks in the 88th percentile. Newmont also has an F-Score of 9, which is above the sector median of 4 and ranks in the 99th percentile.
Newmont has a Value Grade of C, based on a score of 55, which is average. The company ranks in the 16th percentile for its shareholder yield and in the 17th percentile for its enterprise-value-to-EBITDA ratio. It has a shareholder yield of 4.8% and an enterprise-value-to-EBITDA ratio of 6.6. Newmont’s price-earnings ratio of 16.4 ranks in the 41st percentile, while its price-to-free-cash-flow ratio is 24.3, which ranks in the 57th percentile.
The company has a Momentum Grade of A, based on its Momentum Score of 89. This means that the stock’s momentum is very strong in terms of its weighted relative price strength over the last four quarters. The ranks are 91, 39, 96 and 14, sequentially from the most recent quarter. The weighted four-quarter relative price strength is 21.6%.