


This week, we cover a stock-picking strategy based on a company’s cash flow strength and ability to reinvest in its business. The approach uniquely focuses on cash-rich stocks that meet specific criteria for both operating and balance sheet cash flow, called a dual cash flow strategy.
As of October 30, 2026, the AAII Dual Cash Flow screen has an annual average price gain of 11.2% since inception in 1998, versus 7.4% for the S&P 500 index over the same period. Year to date, the Dual Cash Flow screen is up 11.3%, versus the S&P 500’s gain of 10.8% over the same period.
The Origins of Dual Cash Flow Analysis
Cash levels help reveal the financial strength and resources of a company, while cash flow indicates the generation of new cash. Cash flow can reveal whether the company is generating or consuming cash in its normal operation, if it is investing for the future, and whether it is rewarding investors with dividends or seeking additional capital from the equity or debt markets. Cash flow analysis often provides advance notice that a company may be facing financial trouble even though earnings and sales are still looking strong.
In the late 1990s, Ernst Institutional Research took traditional cash flow analysis one step further by developing dual cash flow. The key to dual cash flow analysis is differentiating between the cash flow a company is generating from its operations and the changes in cash on the balance sheet. It is considered desirable for a company to show increasing cash flow from operations while cash flow from balance sheet changes declines. Dual cash flow helps measure the strength and quality of a firm’s cash flow.
While the primary goal of dual cash flow was to help judge cash flow and illustrate the trade-off between growth and liquidity, Harry Ernst and Jeffrey Fotta, Ernst’s longtime partner at the time, used dual cash flow to measure the attractiveness of individual stocks and the market as a whole.
Operating Cash Flow
The dual cash flow method seeks out companies with increasing cash flow from operations but falling cash from balance sheet changes. It favors operating cash flow over cash on hand with the belief that operating cash flow acts as a clear indicator of company performance and profitability. The model views the build-up of excess cash itself as the growth of an unproductive asset. It also looks negatively on the use of cash to make up for declines in operating cash flows. Ernst and Fotta believed that the dual cash flow model could help provide an early signal of downturns or upturns in earnings.
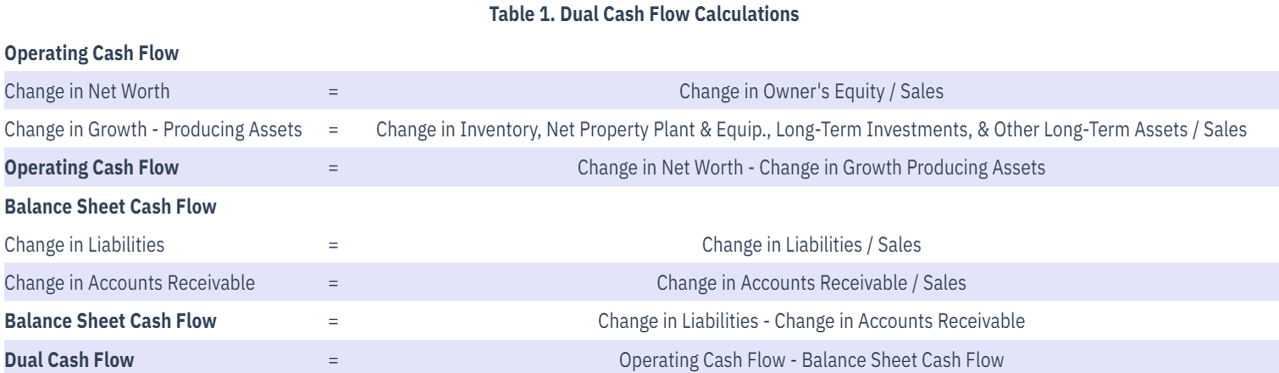
The dual cash flow operating cash flow calculation differs from traditional cash flow calculations. Notably, the model begins with the change in a company’s net worth (assets less liabilities) less changes in net property, plant and equipment; long-term investments; and inventories with the calculations scaled by company sales to make the results comparable to other companies. (The details of the calculation are shown in the table below.)
In other words, it’s the change in owner’s equity minus the change in growth-producing assets.
Two primary events lead to changes in net worth, also known as book value. The first is issuance or redemption of common stock. When a company issues common stock, the cash proceeds are credited to cash on the asset side of balance sheet, while an increase in net worth counterbalances the cash increase. Basically, the opposite occurs with a share buyback.
However, net income or earnings provides the more important and frequent change to net worth. Net income less dividends paid to common shareholders is added to retained earnings, which is normally the largest component of net worth. Basically, dual cash flow starts off its analysis by seeking out firms with growing net income building up a firm’s net worth. Furthermore, dual cash flow is normally examined as a percent of sales, much like profit margins. It is not enough for a firm to have increasing levels of earnings; more importantly, the figure should be increasing as a percent of sales. This scaling furthermore allows comparisons across companies.
The second element of the dual cash flow operating cash flow calculation subtracts the change in growth-producing assets from the change in net worth. Growth-producing assets consist of net property, plant and equipment; inventory; and investments. Optimally, a firm should be increasing net income from its growth-producing assets without the need for additional heavy investment.
Balance Sheet Cash Flow
While the first element of dual cash flow looks at operating cash flow, the second element examines the use and creation of cash from the assets and liabilities on the balance sheet. Dual cash flow is constructed using the balance sheet and income statement, but it differs from traditional cash flow statements in a number of ways.
While the statement of cash flows considers changes in accounts payable and accounts receivable as elements of operating cash flow, the dual cash flow model moves these elements into the balance sheet cash flow calculation. Within the dual cash flow model, balance sheet cash flow is defined as the change in total liabilities less the change in accounts receivable. The result is normally expressed as a percent of sales.
Dual cash flow seeks companies that are borrowing less, paying back payables more quickly and able to lend out money to customers to support the purchase of goods through accounts receivable. The ideal firm is generating enough cash from operations with no need for additional cash from balance sheet maneuvers.
Members are looking for your input. Can you help with this question from the Stock Screening & Analysis Community?
How do you evaluate a company’s financial strength when choosing stocks? Do you focus more on earnings, operating cash flow or the cash a company holds on its balance sheet? Why?
Click here and then choose the Join Community button on the right to answer this question or read their responses.
Constructing a Dual Cash Flow Screen
Ernst and Fotta felt that the best-situated companies show cash flow from operations rising from one quarter to the next, while cash flow from balance sheet maneuvers is on the decline. The reverse is true for the worst-situated companies.
We use Stock Investor Pro, AAII’s fundamental stock screening and research database, to calculate dual cash flow and look for firms with strong and increasing dual cash flow. Stock Investor Pro covers a stock universe of over 6,700 exchange-listed stocks. Our first screen excludes non-exchange-traded over-the-counter (OTC) stocks. This helps to ensure a minimum level of liquidity and access to current financial statement data.
The next screen requires positive cash flow from operations for each of the last two quarters. We then require negative balance sheet cash flow for each of the last two quarters.
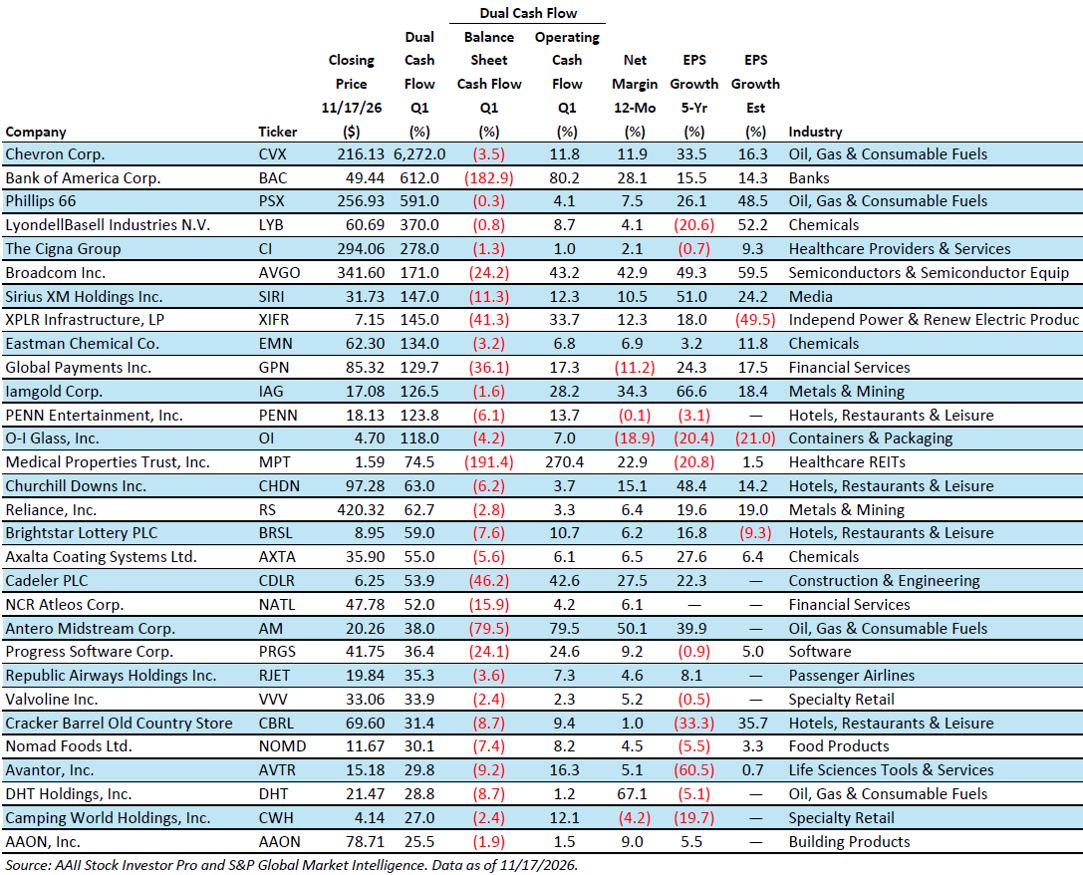
Our final screen requires increasing dual cash flow over each of the last four quarters. The results of the screen are displayed in the table below.
The operating and balance sheet dual cash flow for the most recent quarter are included, along with the dual cash flow figure.
Conclusion
A strength of cash flow is that it reflects a company’s true operating performance. Dual cash flow extends the analysis by considering both operating cash flow and balance sheet cash flow, highlighting whether a company is generating cash from its business or simply raising cash from the balance sheet—a move that usually only helps meet short-term liquidity needs.
Top 30 Stocks Passing the Dual Cash Flow Screen (Ranked by Dual Cash Flow Q1)
Keep in mind that no matter how well a stock screening methodology has performed (or how badly it has underperformed) over the long term, stock screening is only the first step in the stock selection process. You will want to do your homework to see why these companies are at their current levels. Only then will you gain insight into those that will continue to languish and those that may eventually flourish.
The stocks meeting the criteria of the approach do not represent a “recommended” or “buy” list. It is important to perform due diligence to verify the financial strength of the passing companies and to identify those stocks that match your investing tolerances and constraints before committing your investment dollars. Keep in mind that the quantitative screens AAII has developed are based upon our interpretations of published works tied to the market gurus.