
March Charts of Interest: The War's Impact on the Economy and Stocks

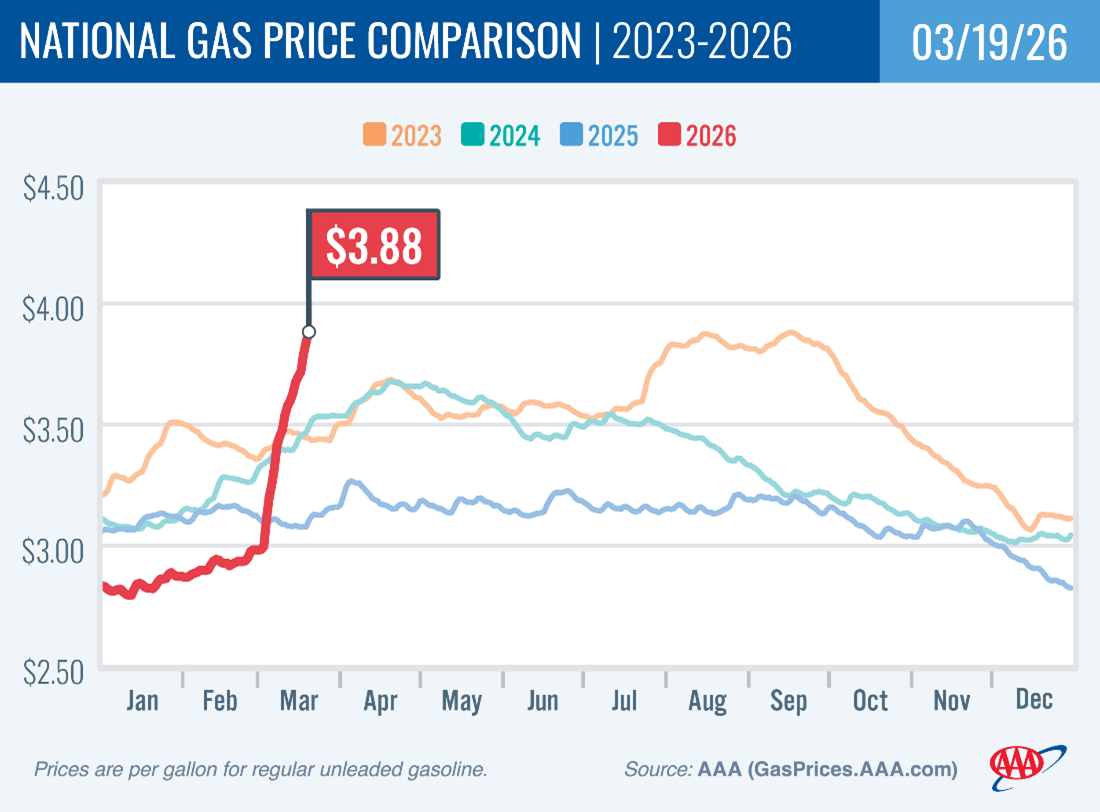
The effects of the Iran war have been felt immediately by consumers across the world. Last night, I paid $3.74 per gallon of gas to fill up my car at Costco. Like many of you, I didn’t need to see the chart below from AAA to know how gas prices are trending. (AAA listed the national average price as $3.884 per gallon as of this morning.)
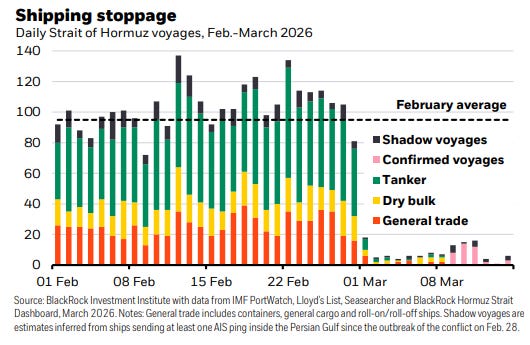
The Strait of Hormuz Blockade Has a Global Impact
About 20% of the world’s oil and liquefied natural gas (LNG) passes through the Strait of Hormuz, which is currently being blocked by Iran. While the U.S. is a net exporter of oil, most other countries are not. BlackRock noted that Japan, for instance, gets about 70%–90% of its oil and about 10%–15% of its liquified natural gas via the strait.
As we are all seeing at the gas pump, a disruption in one area of the global economy can have a far-reaching effect.
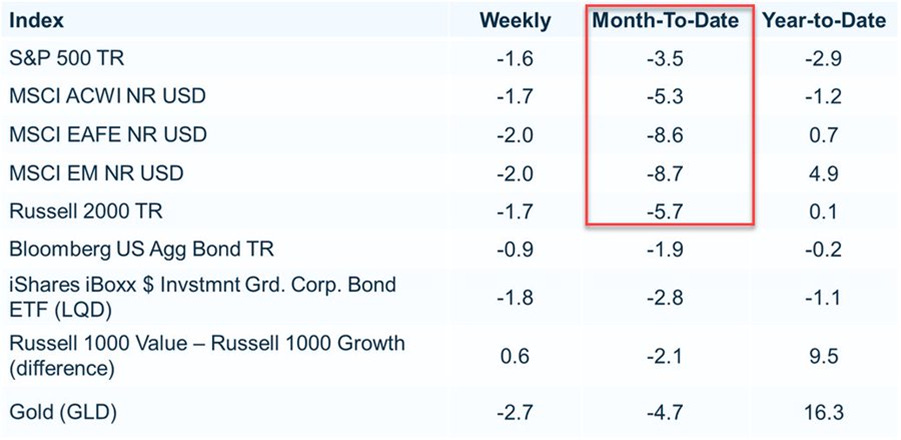
The Rotation Among Asset Classes
We at AAII have observed a rotation among asset classes since the Iran war started. We are certainly not alone in making this observation. Yesterday, Ryan Detrick, CMT, of Carson Group shared this table. Notice that large-cap U.S. stocks have been falling less than other stock categories.
Source: Ryan Detrick.
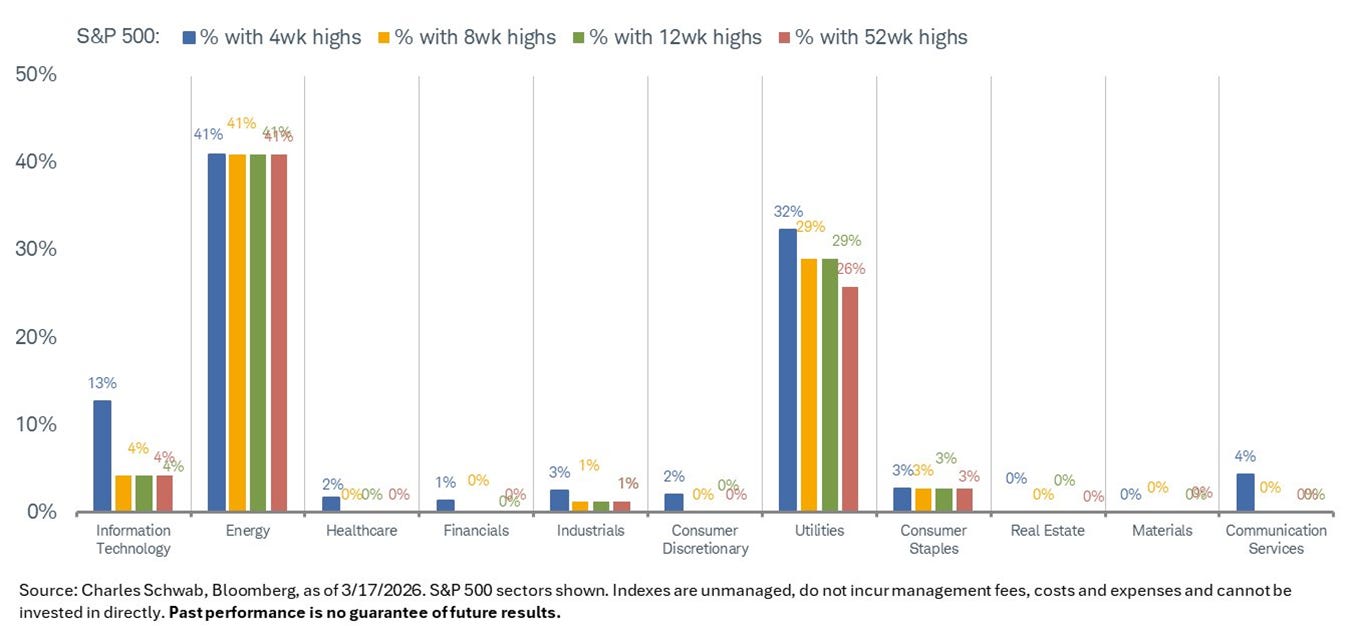
Within U.S. large-cap stocks, energy and utilities stocks are outperforming, as shown in this chart posted yesterday by Charles Schwab’s Liz Ann Sonders.
Oil Stocks Have Risen Less than Oil Prices
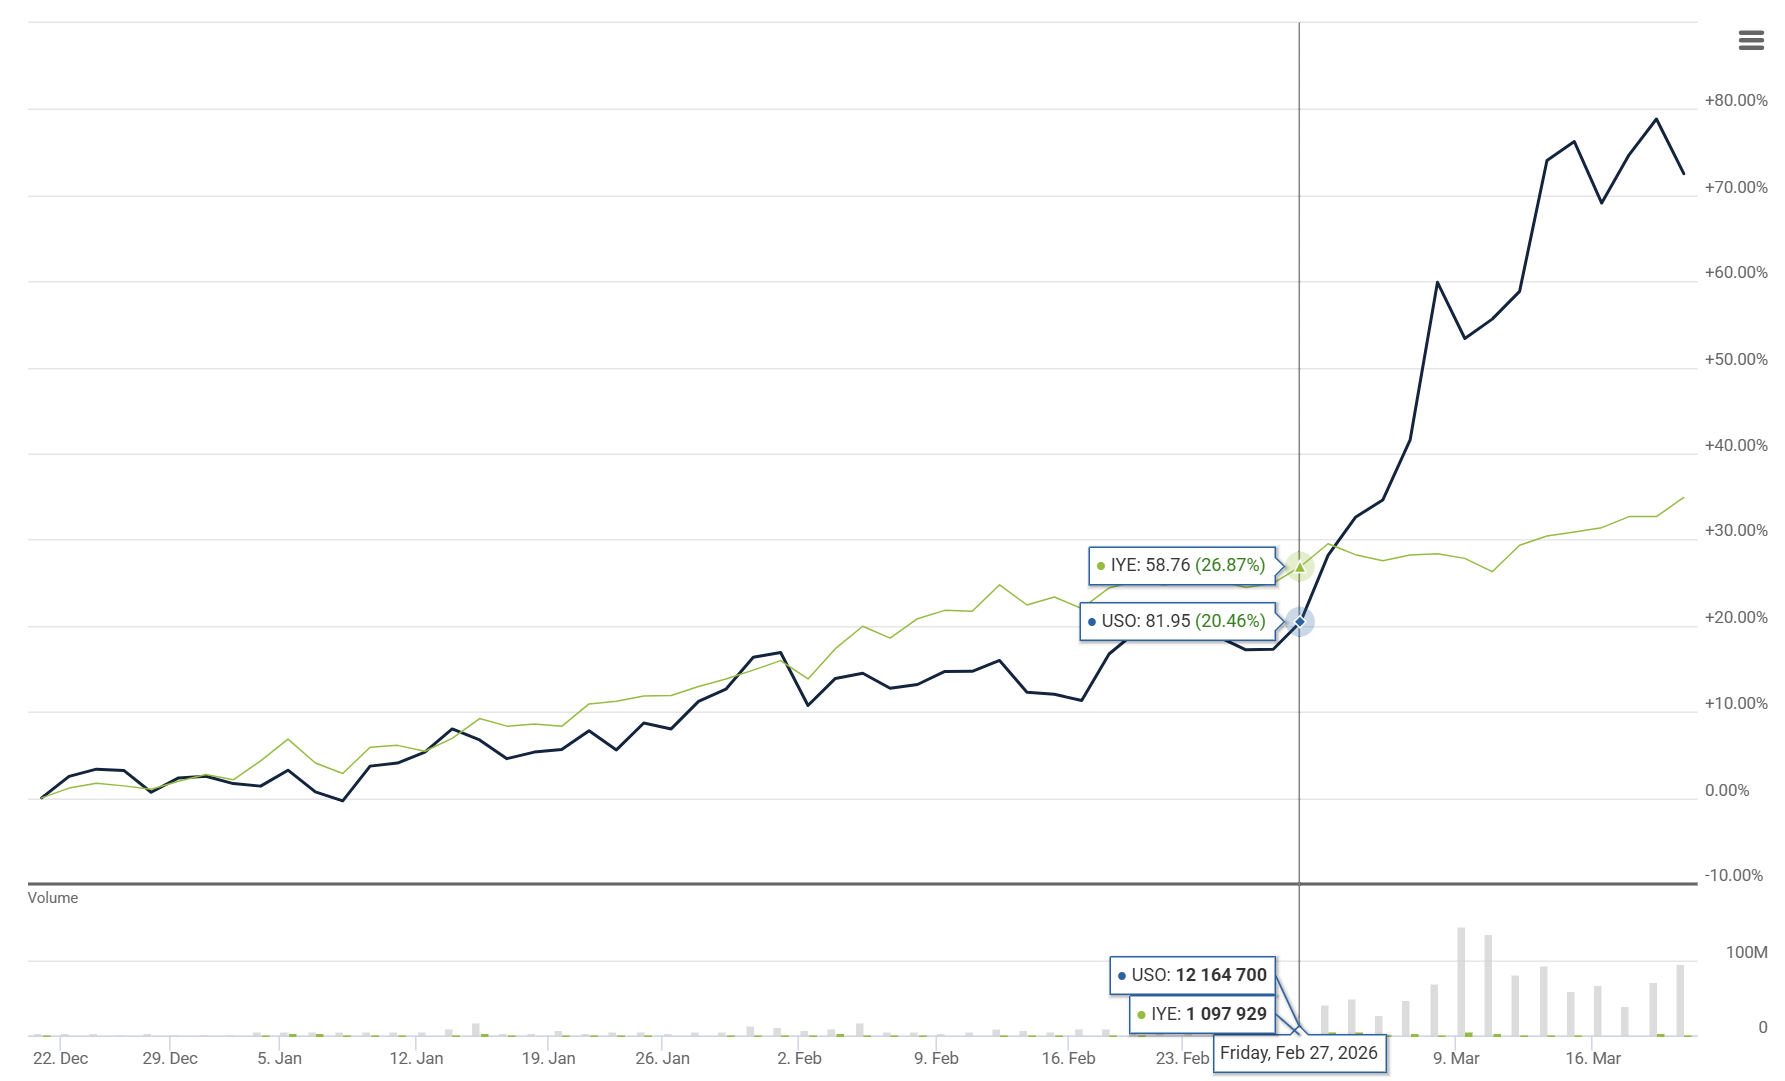
Here is an updated version of a chart I shared in our Dividend Investing (DI) newsletter last week. United States Oil ETF (USO) tracks the daily price movements of light, sweet crude oil. The other fund in the chart, iShares U.S. Energy ETF (IYE), tracks an index of U.S. energy producers. Exxon Mobil Corp. (XOM) and Chevron Corp. (CVX) account for nearly 40% of the exchange-traded fund’s (ETF) portfolio.
The vertical line in the chart is set at February 27, right before the Iran war began. As you can see, there is a big difference in how each ETF has performed since then. This difference is due to oil’s price volatility being much higher than the ability of oil companies to adjust their production levels.
Source: AAII.com and QuoteMedia. Data as of 3/19/2026.
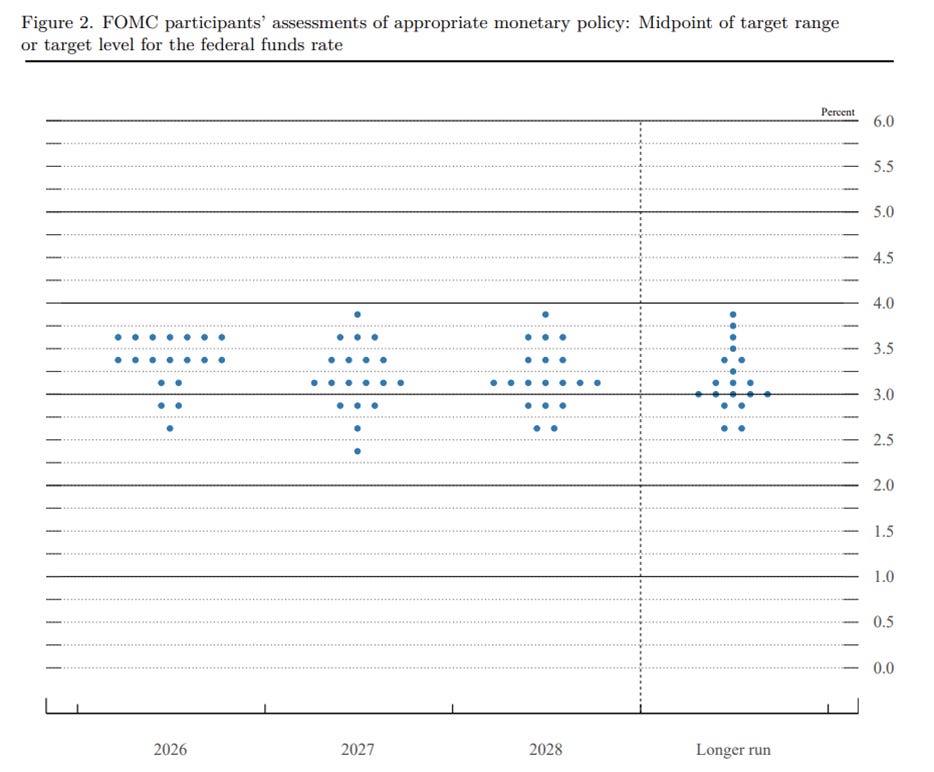
More Consensus at the Fed, For Now …
The headlines tell you that the Federal Open Market Committee (FOMC) voted to leave interest rates unchanged yesterday. Uncertainty about the Iran war factored into the committee’s decision.
What was not as widely reported is the tighter consensus among committee members for where interest rates will be at the end of 2026. Yesterday’s updated FOMC projections effectively call for just one 0.25% interest rate cut. Even the dovish Federal Reserve governor Stephen Miran adjusted his expectations closer to those of other FOMC peers. (Miran’s term is set to expire at the end of this month.)
As always, these forecasts are subject to change.
Source: Federal Open Market Committee.

More on AAII.com
Asset Class Returns: Highest Returns for International Stocks Since 2012
Developed country stocks saw their returns bounce back in a big way in 2025.Fed Signals That Investors Should Watch and What They Mean
Incorporating Federal Reserve policy shifts into an investing model rooted in 12 market anomalies.How the Components of A+ Grades Help You Analyze Stocks
Read about how combining the criteria behind multiple grades provides more robust analysis than relying on a single factor in the March 2026 AAII Journal.
AAII Sentiment Survey
Pessimism among individual investors about the short-term outlook for stocks increased in the latest AAII Sentiment Survey. Meanwhile, optimism and neutral sentiment decreased.
Bullish sentiment, expectations that stock prices will rise over the next six months, decreased 1.5 percentage points to 30.4%. Bullish sentiment is below its historical average of 37.5% for the fifth consecutive week.
Neutral sentiment, expectations that stock prices will stay essentially unchanged over the next six months, decreased 4.1 percentage points to 17.6%. Neutral sentiment is unusually low and is below its historical average of 31.5% for the 87th time in 89 weeks.
Bearish sentiment, expectations that stock prices will fall over the next six months, increased 5.6 percentage points to 52.0%. Bearish sentiment is unusually high and is above its historical average of 31.0% for the sixth consecutive week.
The bull-bear spread (bullish minus bearish sentiment) decreased 7.2 percentage points to –21.6%. The bull-bear spread is unusually low and is below its historical average of 6.5% for the sixth consecutive week.
This week’s special question asked AAII members which market-capitalization style of stocks they expect to outperform over the next six months.
Here is how they responded:
Small-cap stocks: 19.1%
Mid-cap stocks: 15.8%
Large-cap stocks: 30.2%
Not sure/no opinion: 34.9%
This week’s Sentiment Survey results:
Bullish: 30.4%, down 1.5 points
Neutral: 17.6%, down 4.1 points
Bearish: 52.0%, up 5.6 points
Historical averages:
Bullish: 37.5%
Neutral: 31.5%
Bearish: 31.0%
See more Sentiment Survey results.