
June Charts of Interest: A New Fed Chair and Rising Rate Expectations

Kevin Warsh’s first Federal Open Market Committee (FOMC) meeting as Federal Reserve chairman was notable for both the increase in interest rate expectations and the announcement of new task forces. Against that backdrop, the U.S. and Iran reached an agreement to finally reopen the Strait of Hormuz at least for 60 days. This month’s charts of interest covers what’s changed in interest rates and bond yields, what it means for mortgages and the broader economy, and the shipping disruption caused by the Iran war.
As a reminder, the charts of interest highlight charts and tables I’ve come across that haven’t made their way into other AAII commentaries.
The FOMC Welcomes Warsh With Higher Expected Interest Rates
Warsh’s term as Fed chairman is starting with increased expectations for an interest rate hike. The so-called dot plot below shows FOMC members now expecting the federal funds target rate to be 3.8% by the end of this year. This is up from the 3.4% committee members had forecast three months ago.
Yesterday’s unanimous committee vote holds rates steady for now at a range of 3.50% to 3.75%.
Source: Federal Open Market Committee.
Among the new task forces Warsh announced yesterday was one focused on Fed communication. He believes that committee members should be less public about their interest rate expectations. Whether this means the dot plot’s days are numbered remains to be seen.
Traders Think Two Interest Rate Hikes May Occur
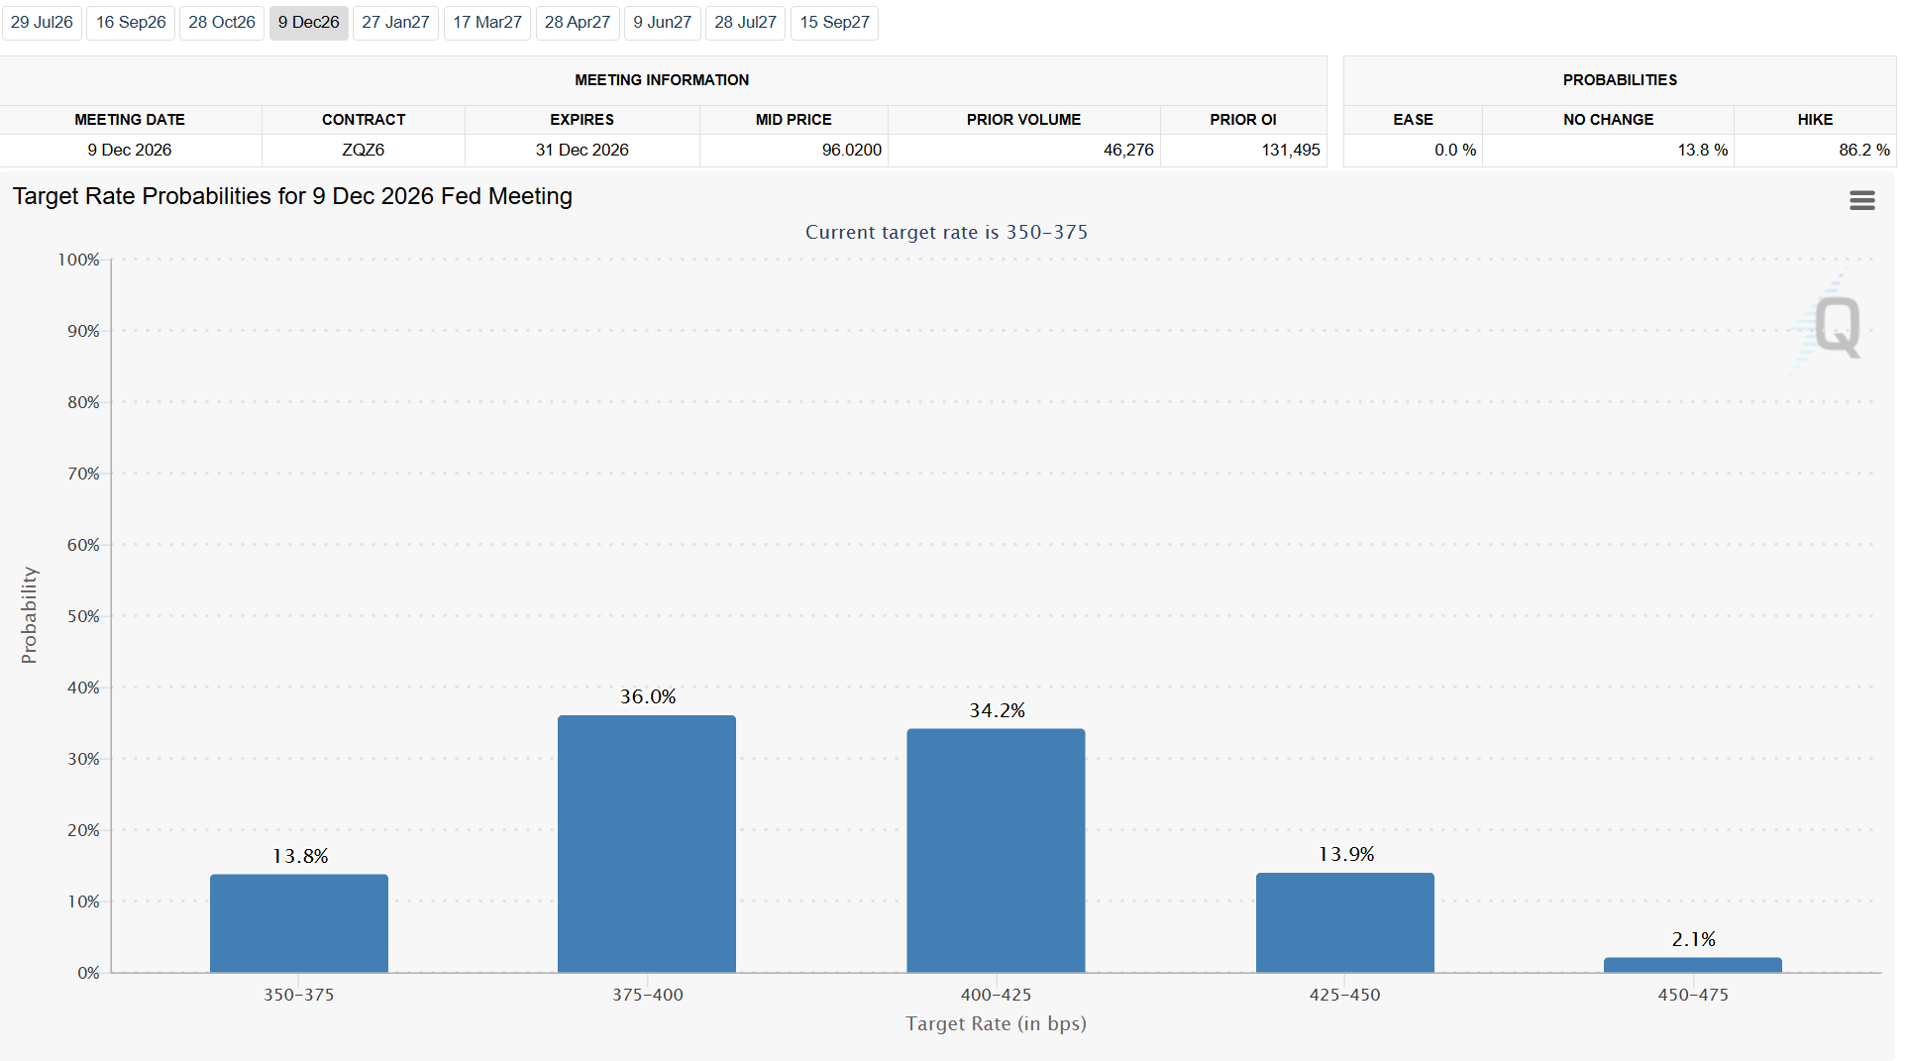
Following yesterday’s announcement, the CME FedWatch Tool is showing greater expectations for two interest rate hikes. The tool measures the odds traders are pricing into federal funds futures contracts. As of this afternoon, traders now think there is a 50.2% chance of interest rates being raised at least twice before the end of this year. Three months ago, those odds were just 18.0%.
Source: CME Group.
The Start of a Less Verbose FOMC?
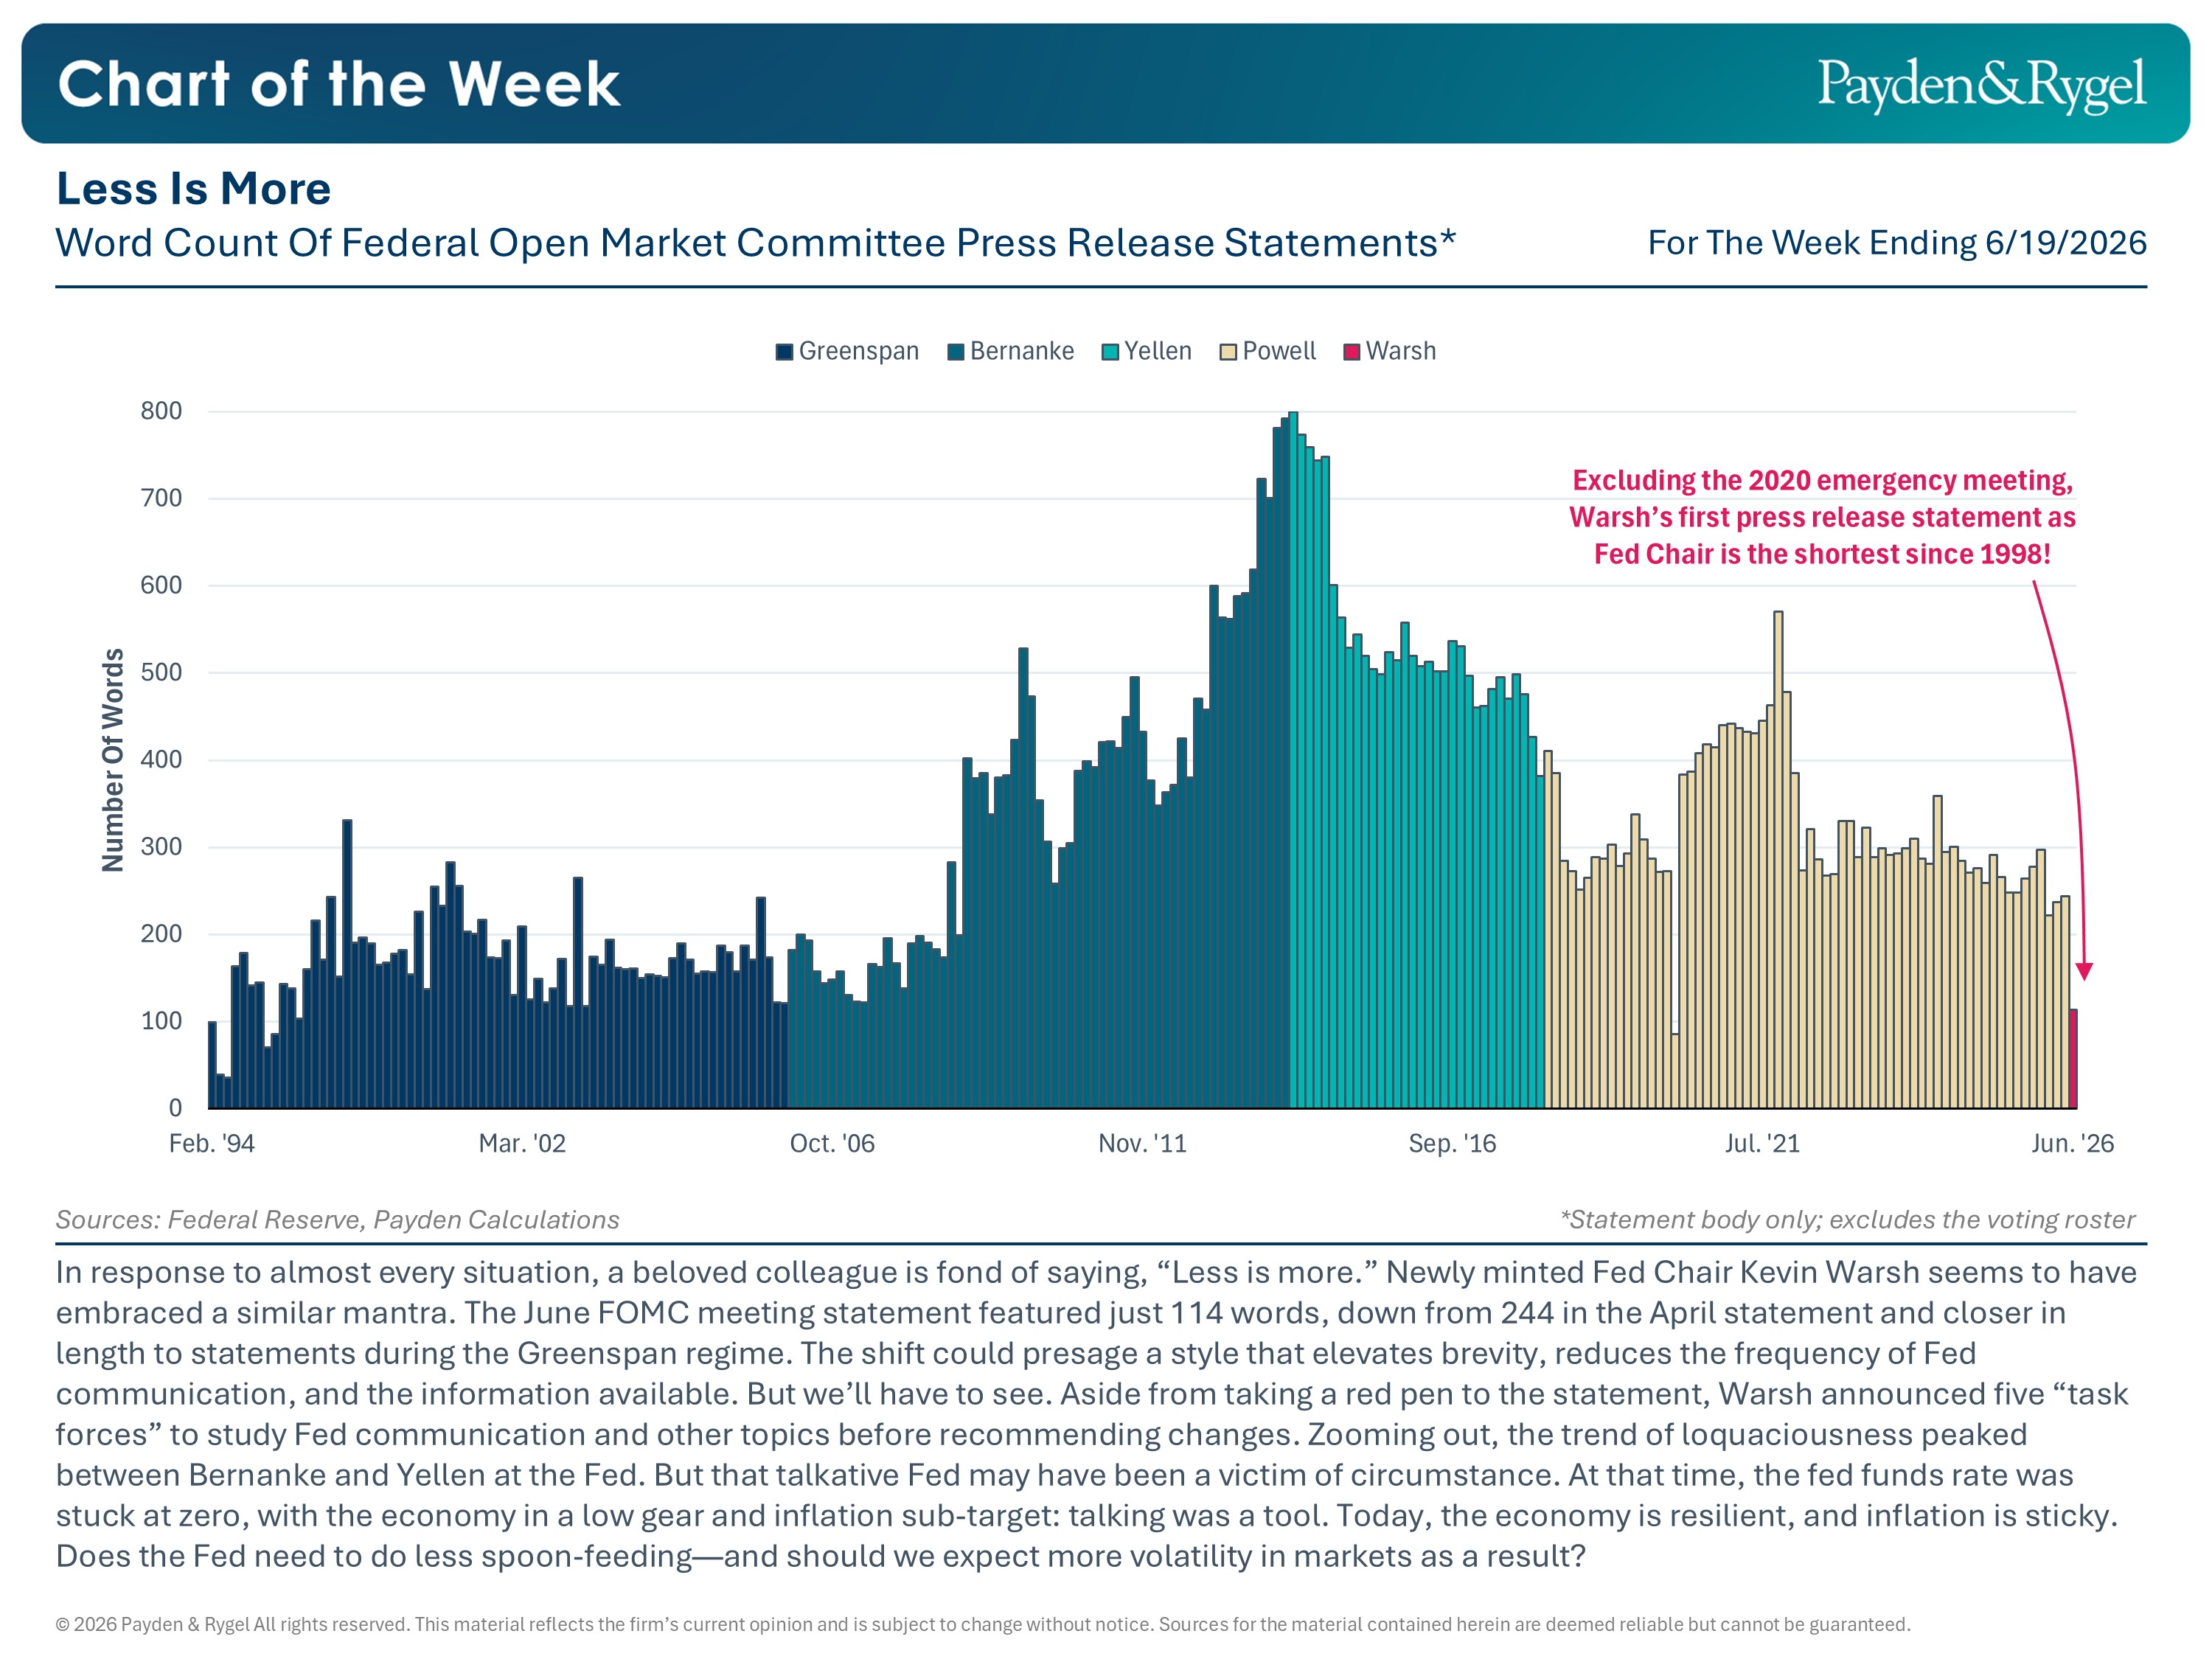
Investment firm Payden & Rygel observed that yesterday’s FOMC statement was the shortest since 1998, outside of the 2020 emergency meeting. Payden & Rygel counted just 114 words. This compares to 244 words in the April 2026 statement—the last one issued under Jerome Powell’s term as Fed chairman.
What does this mean for investors and the markets? It is too early to tell. Still, given Warsh’s desire to communicate less, it is interesting.
The Yield Curve Has Steepened and Risen
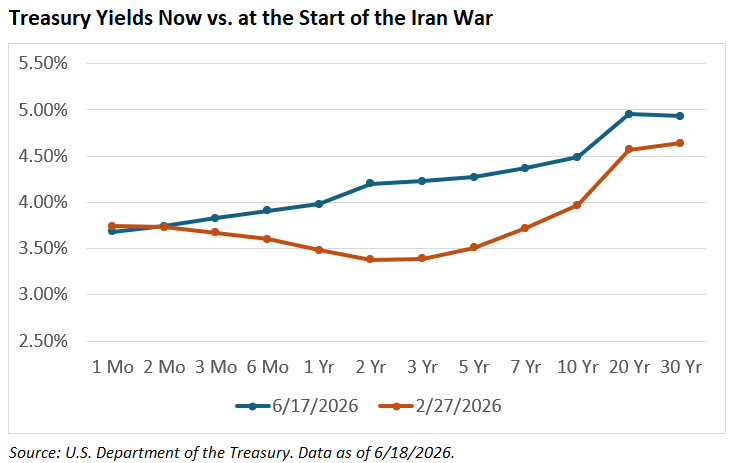
Two things have happened to the Treasury yield curve since the Iran war started. First, interest rates have risen across most maturities. Second, the yield curve has stopped being inverted. This change is particularly noticeable in the middle part of the curve, with two-year through 10-year yields making the biggest upward moves.
The changes are good if you are a saver, but bad if you are a borrower.
Opening the Strait of Hormuz Will Relieve a Big Bottleneck
The U.S. and Iran’s memorandum of understanding calls for the Strait of Hormuz to be opened with no tolls charged for the next 60 days.
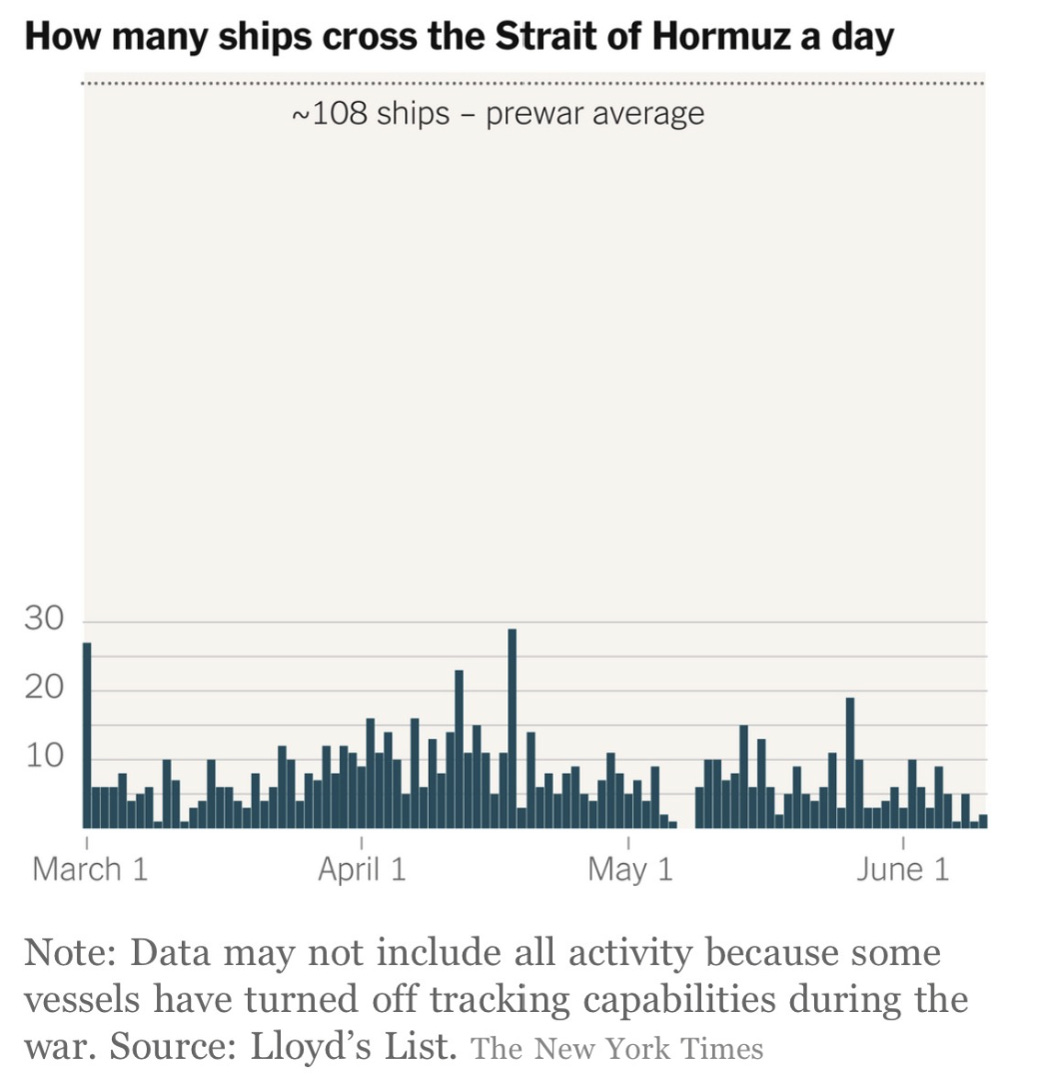
Regardless of what you think about the agreement’s terms, the strait’s closure has led to a massive bottleneck, as shown in the chart below from the New York Times. The big space between the top dotted line and where the columns appear at the bottom illustrates how proportionately little traffic has crossed the strait in recent months.
An average of approximately 108 ships crossed the Strait of Hormuz every day before the Iran war. It’s been about four weeks since more than 10 known ships have crossed the strait on a single day.
We don’t know which ships will cross the strait first once it finally opens. Some reports suggest that oil tankers will get priority. Even if they do, it will take considerable time for global energy supplies to be rebuilt.
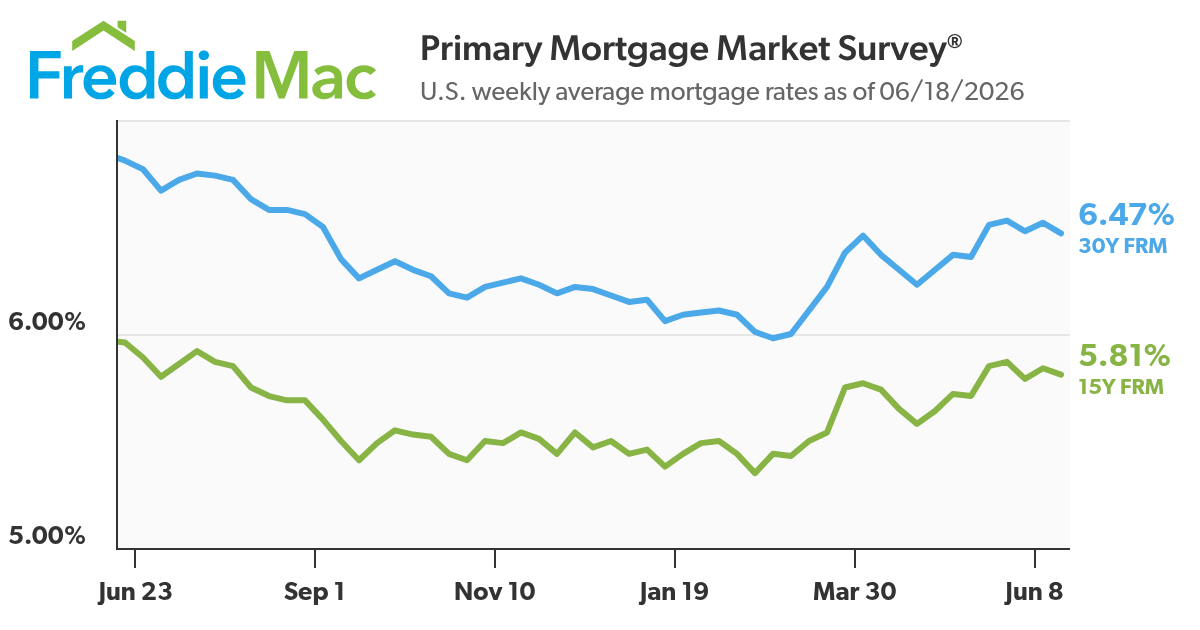
Mortgage Rates Near Nine-Month Highs
Even with this week’s decline, the national average interest rate on a 30-year fixed-rate mortgage remains at levels not seen since last September. This isn’t surprising given the rise in bond yields. Nonetheless, the economic data suggests that purchase demand “is continuing to modestly improve,” according to Freddie Mac.
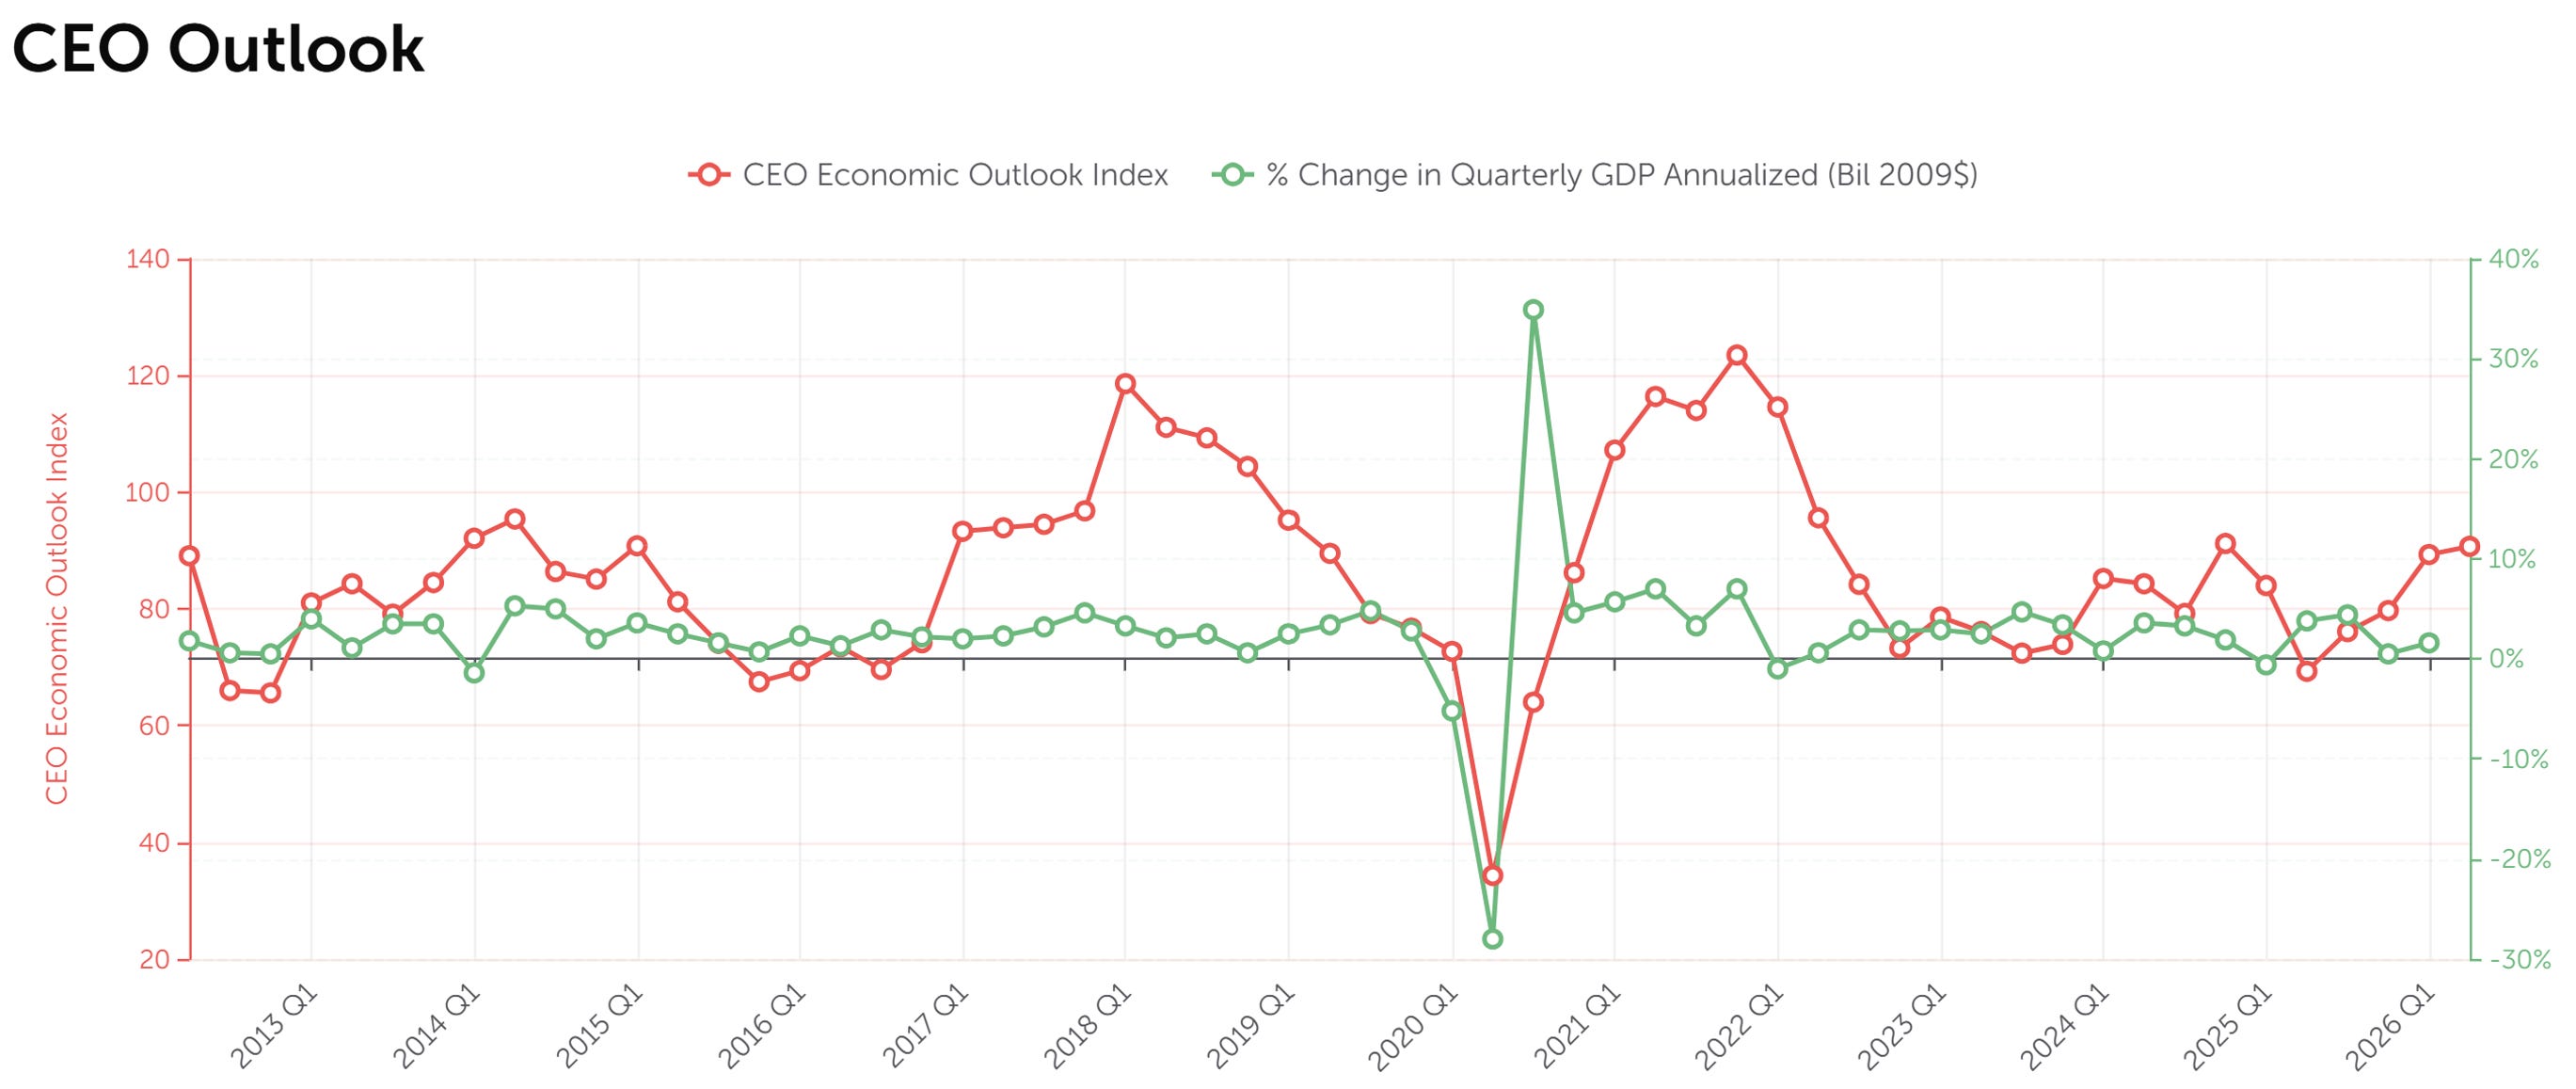
CEOs Are Feeling More Optimistic
Business Roundtable’s latest CEO Economic Outlook Survey shows optimism at its highest level since late 2024. Driving the gains were stronger expectations for sales and spending on capital investment. Hiring expecations barely moved and are just slightly above the breakpoint that separates growth and contraction. Responses to this survey were collected between June 2 and June 12.
Source: Business Roundtable.

More on AAII.com
Identifying Future Economic Changes With the Yield Curve
A positive, upward-sloping yield curve is a sign of economic expansion. A negative, inverted yield curve is a harbinger of economic contraction.The Fed Model’s Role in Market Valuation and Sentiment Analysis
The Fed Model offers a simple and intuitive way to compare stock and bond valuations, but its theoretical and practical weaknesses need to be understood.2026 Robo-Advice Landscape: Survivors Search for the Next Leg of Growth
The June 2026 AAII Journal reports that with most early adopters already established as clients, robo-advice platforms compete on scale, pricing, planning depth and customization.
AAII Sentiment Survey
Pessimism among individual investors about the short-term outlook for stocks decreased in the latest AAII Sentiment Survey. Meanwhile, optimism and neutral sentiment increased.
Bullish sentiment, expectations that stock prices will rise over the next six months, increased 6.2 percentage points to 36.6%. Bullish sentiment is below its historical average of 37.5% for the fifth consecutive week.
Neutral sentiment, expectations that stock prices will stay essentially unchanged over the next six months, increased 2.1 percentage points to 24.1%. Neutral sentiment is below its historical average of 31.5% for the 100th time in 102 weeks.
Bearish sentiment, expectations that stock prices will fall over the next six months, decreased 8.3 percentage points to 39.4%. Bearish sentiment is above its historical average of 31.0% for the 19th consecutive week.
The bull-bear spread (bullish minus bearish sentiment) increased 14.5 percentage points to –2.8%. The bull-bear spread is below its historical average of 6.5% for the 18th time in 19 weeks.
This week’s special question asked AAII members which market-capitalization style of stocks they expect to outperform over the next six months.
Here is how they responded:
Small-cap stocks: 27.1%
Large-cap stocks: 25.4%
Mid-cap stocks: 19.9%
Not sure/no opinion: 26.5%
This week’s Sentiment Survey results:
Bullish: 36.6%, up 6.2 points
Neutral: 24.1%, up 2.1 points
Bearish: 39.4%, down 8.3 points
Historical averages:
Bullish: 37.5%
Neutral: 31.5%
Bearish: 31.0%
See more Sentiment Survey results.

AAII Asset Allocation Survey
Individual investors’ allocations to stocks increased while bond and cash allocations decreased in the May AAII Asset Allocation Survey.
Stock and stock fund allocations increased 1.3 percentage points to 69.8%. Stock and stock fund allocations are above their historical average of 61.5% for the 72nd consecutive month.
Bond and bond fund allocations decreased 0.7 percentage points to 14.9%. Bond and bond fund allocations are below their historical average of 16.0% for the seventh time in eight months.
Cash allocations decreased 0.6 percentage points to 15.3%. Cash allocations are below their historical average of 22.5% for the 42nd consecutive month.
May AAII Asset Allocation Survey results:
Stocks and Stock Funds: 69.8%, up 1.3 percentage points
Bonds and Bond Funds: 14.9%, down 0.7 percentage points
Cash: 15.3%, down 0.6 percentage points
May AAII Asset Allocation Details:
Stocks: 32.0%, up 2.4 percentage points
Stocks Funds: 37.8%, down 1.2 percentage points
Bonds: 4.0%, down 0.6 percentage points
Bond Funds: 11.0%, down 0.0 percentage points
Historical averages:
Stocks/Stock Funds: 61.5%
Bonds/Bond Funds: 16.0%
Cash: 22.5%
Take the Asset Allocation Survey.