

As second-quarter 2026 earnings season gains momentum, it can be tough to keep up with every earnings report. Fortunately, AAII’s My Portfolio makes it easy to stay on top of your stocks. This week, I show you how using the Custom View Builder—a feature that is available to all AAII members.
The Custom View Builder in My Portfolio provides access to over 200 data fields. These include financial statement data, valuations, momentum, prices and earnings estimates. For the purposes of creating an earnings season view, I focus on the announcement date, earnings estimates, surprises and year-over-year growth fields.
Setting Up Your Custom View
To access the Custom View Builder, go to My Portfolio and open a portfolio (or create one if you haven’t already). Then, click on the plus sign next to the View drop-down menu just above your portfolio.

A new window will appear listing the data categories and fields. To add a field to a custom view, just click on it. You’ll see a running list of fields you have selected at the far right.
Earnings Estimates Fields
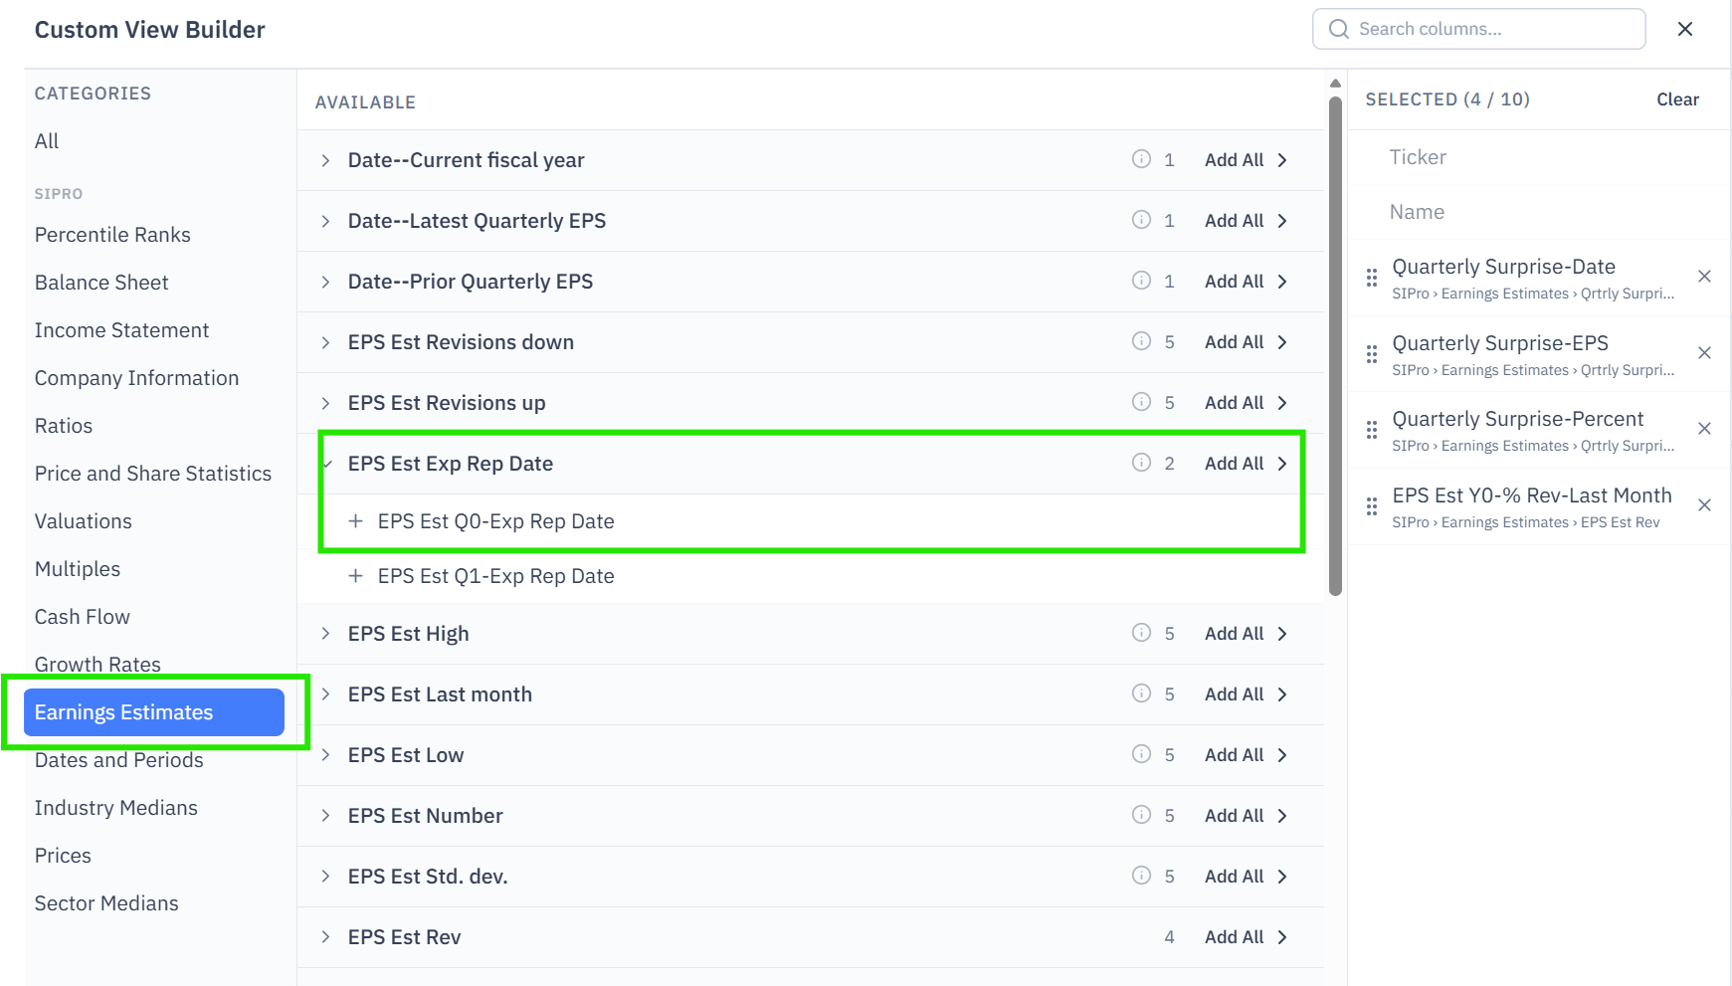
In creating an earnings season view, I started by adding the following data fields from the Earnings Estimates category.
EPS Est Q0-Exp Rep Date (located under “EPS Est Exp Rep Date”) is when a company is expected to report its latest earnings. This date may be an estimate if a company has yet to announce its earnings release date.
Quarterly Surprise-Date (located under “Qtrly Surprise Qtr-Date”) is the date the company most recently announced its earnings. It does not update until after a company has announced its latest earnings.
Quarterly Surprise-EPS (located under “Qtrly Surprise Qtr-EPS”) is the reported earnings for the most recent quarter.
Quarterly Surprise-Percent (located under “Qtrly Surprise Qtr-Percent”) is how much a company’s announced earnings were above or below the consensus earnings estimate for the quarter.
EPS Est Y0-% Rev-Last Month (located under “EPS Est Rev”) is how much the consensus earnings estimate for the current fiscal year has changed over the past four weeks. It is a useful measure of whether analysts are more optimistic or pessimistic about a company’s outlook.
Growth Rates Fields
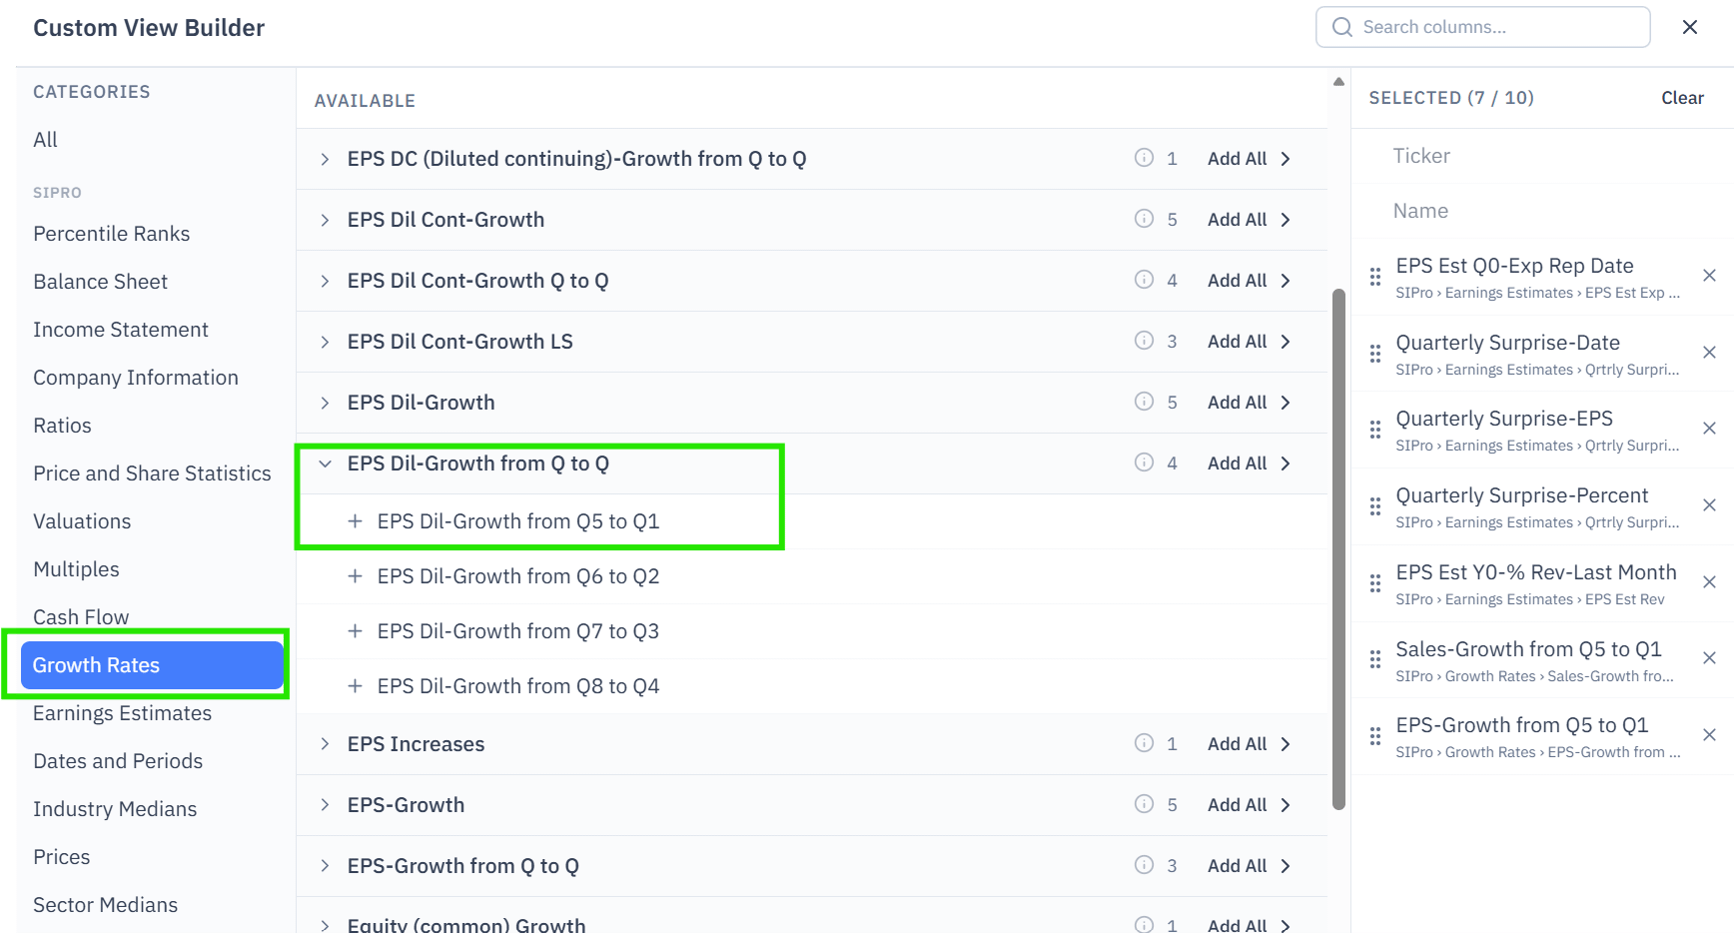
Beyond whether a company beat, met or missed expectations, we want to know whether sales and earnings grew. The Growth Rates category has particularly relevant data fields we can add.
Sales-Growth from Q5 to Q1 (located under “Sales-Growth from Q to Q”) is the percentage change in sales for the most recent quarter compared to the same quarter one year (i.e., four quarters) earlier.
EPS Dil-Growth from Q5 to Q1 (located under “EPS Dil-Growth from Q to Q”) is the percentage change in diluted earnings per share for the most recent quarter compared to the same quarter one year (i.e., four quarters) earlier.
What the Completed View Looks Like
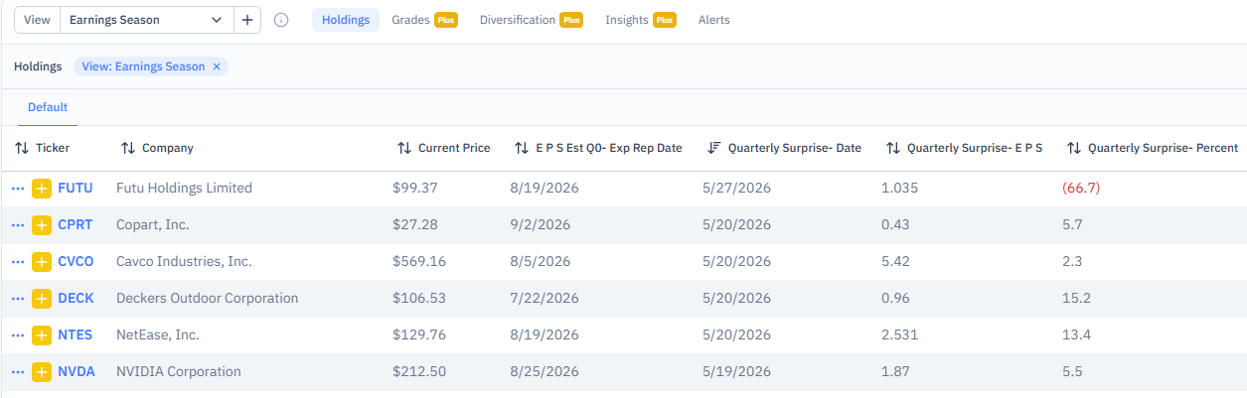
Here is a preview of the completed view. I populated the portfolio with the stocks currently passing the Buffett Hagstrom screen.
Adding More Fields
All AAII members can add up to 10 data fields when building their custom views. (There are no limits for A+ Investor and AAII Platinum subscribers.) A potential candidate to include is the Quarterly Surprise-SUE Q1, which is the number of standard deviations the actual announced earnings differ from the estimated earnings for a company. (SUE stands for standardized unexpected earnings.) It shows whether earnings truly surprised (larger numbers) or were within the range of analysts’ expectations (smaller numbers). You can find it in the Earnings Estimates category under “Qrtrly Surprise Qtr-SUE.”
Gross and operating margins can be found in the Ratios category. The price-earnings (P/E) ratio and other valuation ratios (including yield) are located in the Multiples category. The Price and Share Statistics category includes relative strength criteria, as does the Percentile Ranks category.
Saving and Editing Your View
Be sure to save your view after you create it. The Save View button is located at the bottom-right corner of the Custom View Builder. Should you wish to edit your view, simply open the View drop-down menu and click on the pencil icon located to the right of the view’s name.


More on AAII.com
AI for Financial Document Analysis: Your Net in a Sea of Information
Quickly processing news and reports with AI tools allows your finite attention to focus on interpretation and decision-making.Find a Stock’s Earnings Estimate Revisions
Why revisions to earnings estimates are important and where you can find revisions data and tools on AAII.com.Discovering Growth Beyond the Headlines
The July 2026 AAII Journal delves into two growth investing strategies that emphasize sustainable metrics, valuation awareness and avoiding glamour stocks.
AAII Sentiment Survey
Optimism among individual investors about the short-term outlook for stocks increased in the latest AAII Sentiment Survey. Meanwhile, neutral sentiment and pessimism decreased.
Bullish sentiment, expectations that stock prices will rise over the next six months, increased 8.6 percentage points to 44.9%. Bullish sentiment is above its historical average of 37.5% for the second time in nine weeks.
Neutral sentiment, expectations that stock prices will stay essentially unchanged over the next six months, decreased 4.3 percentage points to 22.2%. Neutral sentiment is unusually low and is below its historical average of 31.5% for the 104th time in 106 weeks.
Bearish sentiment, expectations that stock prices will fall over the next six months, decreased 4.3 percentage points to 32.9%. Bearish sentiment is above its historical average of 31.0% for the 23rd consecutive week.
The bull-bear spread (bullish minus bearish sentiment) increased 22.9 percentage points to 12.0%. The bull-bear spread is above its historical average of 6.5% for the second time in four weeks.
This week’s special question asked AAII members how, if at all, they’ve changed their approach to investing recently.
Here is how they responded:
I’ve become much more conservative/cautious: 13.6%
I’ve become slightly more conservative: 22.0%
I’ve switched around some investments, but only made modest changes overall: 30.5%
I’ve become more aggressive: 5.1%
No changes: 27.7%
This week’s Sentiment Survey results:
Bullish: 44.9%, up 8.6 percentage points
Neutral: 22.2%, down 4.3 percentage points
Bearish: 32.9%, down 4.3 percentage points
Historical averages:
Bullish: 37.5%
Neutral: 31.5%
Bearish: 31.0%
This week’s Sentiment Survey results:
Bullish: 44.9%, up 8.6 points
Neutral: 22.2%, down 4.3 points
Bearish: 32.9%, down 4.3 points
Historical averages:
Bullish: 37.5%
Neutral: 31.5%
Bearish: 31.0%
See more Sentiment Survey results