

What breaks a particular investment’s yield is part of the three-question stress test I will share during the AAII Income Investing Seminar. An interruption to the income stream or a significant decrease in the stream’s inflation-adjusted value are both ways a yield can “break.”
The stress test itself is a framework for evaluating the riskiness of income-generating investments. These risks cluster into a few categories across asset types. They include deterioration in the issuer’s ability to pay, interest rate moves, structural features like call provisions and inflation-eroding fixed payments.
This week, I share ways that the yields of stocks, bonds and other assets can break as a preview of the seminar.
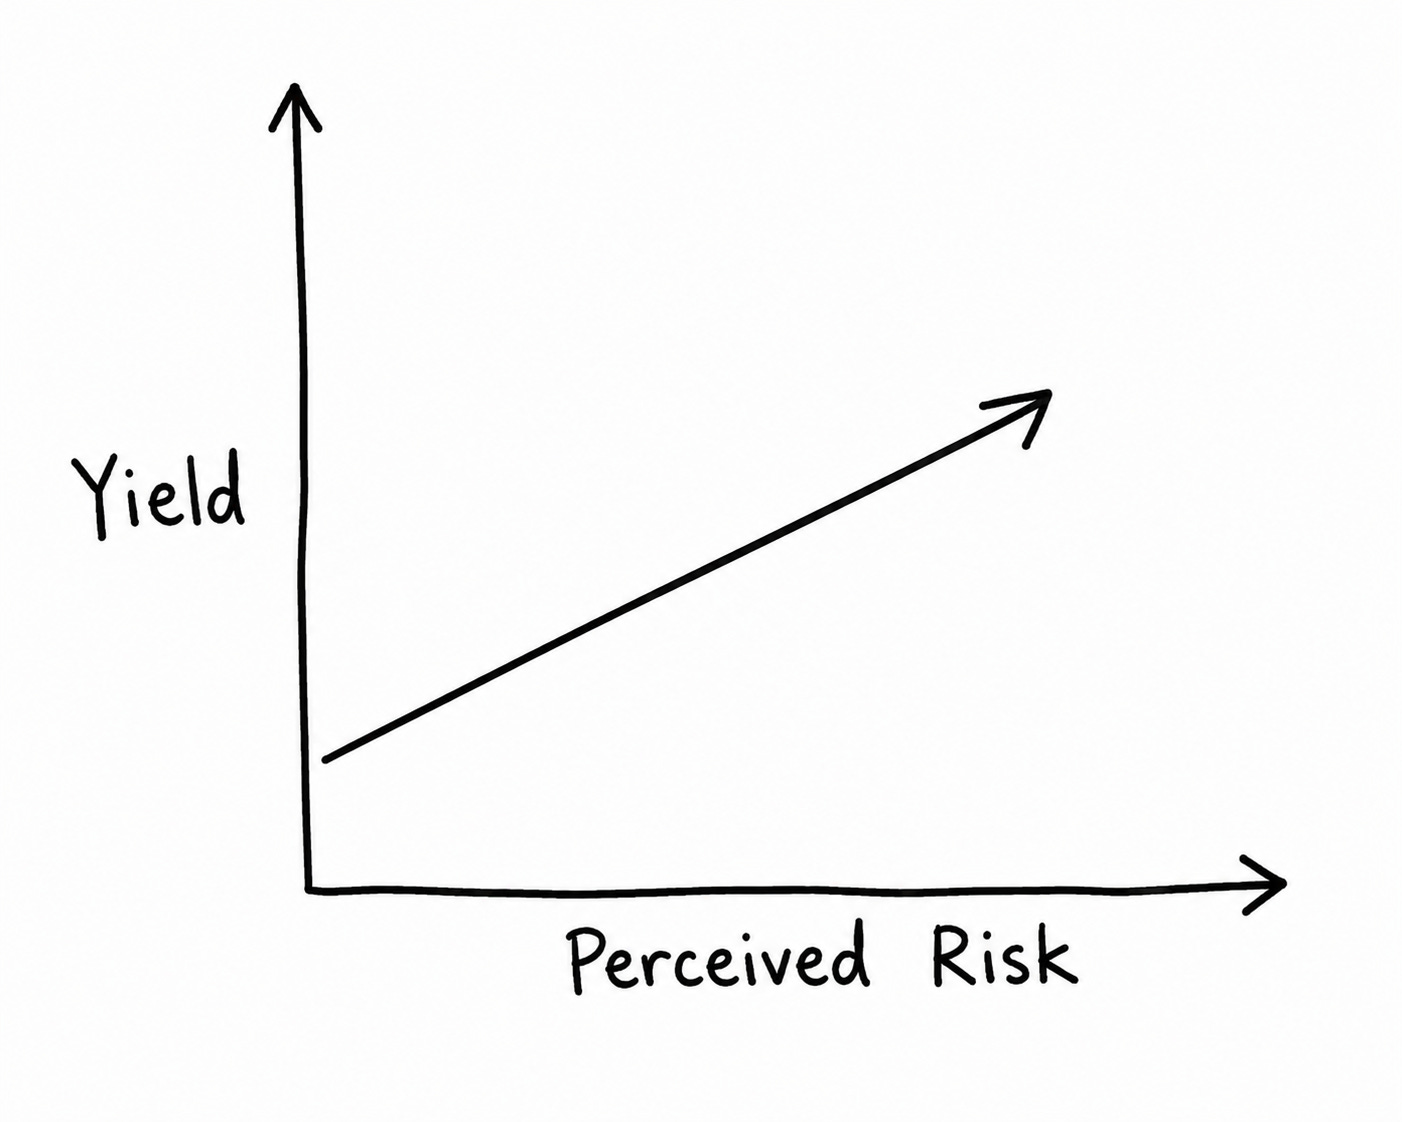
Stocks: Anything that hinders a company’s ability to sustain a dividend breaks the yield. A key ratio for stocks is the payout ratio, which is the dividend divided by earnings. Ratios above 100% mean that the company is paying out more than it earns, which generally can’t continue indefinitely. A decrease in operating cash flow that is not attributable to timing issues is a big warning sign. Yields well above those of sector peers often signal that the market is pricing in extra risk.
Bonds: A significant risk of default will break any bond’s yield. Credit rating downgrades usually precede default; downgrades to B or CCC/Caa ratings are very worrisome. (Avoid any bond with even worse ratings.) Inflation also breaks a bond’s yield because interest payments are fixed on the date of issuance. Even average inflation of 3% reduces the real (inflation-adjusted) value of a coupon by more than half over a 30-year period. The same metrics used to measure a corporation’s ability to pay dividends can be applied to analyze its ability to fulfill its debt obligations. The specific source of revenue for a revenue bond should be monitored as well, since decreases in that revenue could be problematic. Callable bonds can be redeemed early by the issuer, and convertible bonds can be converted to stock—both ending the income stream.
Real Estate Investment Trusts (REITs): A key metric for REITs is funds from operations (FFO). FFO equals net income plus depreciation and amortization, adjusted for gains or losses on real estate sales. Decreases in FFO lead to smaller dividends payments. Slowing economic conditions or rising interest rates can put downward pressure on FFO.
Master Limited Partnerships (MLPs): Part of an MLP’s distribution can be return of capital, which reduces your cost basis. The lower your cost basis, the larger the potential capital gains taxes owed when units are sold in a taxable account. The yield appeal of an MLP will also diminish if unrelated business tax income (UBTI) is realized in an individual retirement account (IRA).
Preferred Stocks: Preferred stock dividends are paid out of earnings and can be cut or suspended for the same reasons that common stock dividends can. Monitor a company’s payout ratio and cash flow. Cumulative preferreds accrue missed dividends that must be paid before common dividends resume; noncumulative preferreds do not. Credit ratings are a useful sustainability check.
Annuities: The income paid by these products may not be as attractive after fees and surrender charges are factored in. Income from fixed annuities is subject to the same inflation risk as bonds.
I will go into more detail about each of these types of investments—as well as exchange-traded funds (ETFs) and mutual funds—in the Income Investing Seminar, which starts on June 4. Learn more about the seminar.

More on AAII.com
Measuring Dividend Sustainability With the Earnings Payout Ratio
How the payout ratio helps an investor determine if earnings are sufficient enough to cover the dividend payment.What Are Bond Ratings and Why Do They Change?
There are many factors considered in creating a bond rating, and the criteria will differ based upon the type of entity being rated.Choosing an Equity Portfolio You Can Live With—for Life
The path matters as much as your portfolio returns themselves. The goal is to find a path smooth enough that you will stay on it. Read how in the May 2026 AAII Journal.
AAII Sentiment Survey
Optimism among individual investors about the short-term outlook for stocks increased in the latest AAII Sentiment Survey. Meanwhile, neutral sentiment and pessimism decreased.
Bullish sentiment, expectations that stock prices will rise over the next six months, increased 3.8 percentage points to 35.6%. Bullish sentiment is below its historical average of 37.5% for the second time in six weeks.
Neutral sentiment, expectations that stock prices will stay essentially unchanged over the next six months, decreased 2.1 percentage points to 22.6%. Neutral sentiment is unusually low and is below its historical average of 31.5% for the 97th time in 99 weeks.
Bearish sentiment, expectations that stock prices will fall over the next six months, decreased 1.8 percentage points to 41.9%. Bearish sentiment is unusually high and is above its historical average of 31.0% for the 16th consecutive week.
The bull-bear spread (bullish minus bearish sentiment) increased 5.6 percentage points to –6.3%. The bull-bear spread is below its historical average of 6.5% for the 15th time in 16 weeks.
This week’s special question asked AAII members how they think the average consumer is faring relative to the start of the year.
Here is how they responded:
Better 8.3%
About the same: 18.2%
Worse: 71.9%
Not sure/no opinion: 0.8%
This week’s Sentiment Survey results:
Bullish: 35.6%, up 3.8 points
Neutral: 22.6%, down 2.1 points
Bearish: 41.9%, down 1.8 points
Historical averages:
Bullish: 37.5%
Neutral: 31.5%
Bearish: 31.0%
See more Sentiment Survey results.

AAII Asset Allocation Survey
Individual investors’ allocations to cash increased while stock and bond allocations decreased in the April AAII Asset Allocation Survey.
Stock and stock fund allocations decreased 0.7 percentage points to 68.5%. Stock and stock fund allocations are above their historical average of 61.5% for the 71st consecutive month.
Bond and bond fund allocations decreased 0.2 percentage points to 15.6%. Bond and bond fund allocations are below their historical average of 16.0% for the sixth time in seven months.
Cash allocations increased by 0.9 percentage points to 15.9%. Cash allocations are below their historical average of 22.5% for the 41st consecutive month.
April AAII Asset Allocation Survey results:
Stocks and Stock Funds: 68.5%, down 0.7 percentage points
Bonds and Bond Funds: 15.6%, down 0.2 percentage points
Cash: 15.9%, up 0.9 percentage points
April AAII Asset Allocation Details:
Stocks: 29.5%, up 0.1 percentage points
Stocks Funds: 39.0%, down 0.7 percentage points
Bonds: 4.6%, down 0.5 percentage points
Bond Funds: 11.0%, up 0.3 percentage points
Historical averages:
Stocks/Stock Funds: 61.5%
Bonds/Bond Funds: 16.0%
Cash: 22.5%
Take the Asset Allocation Survey.