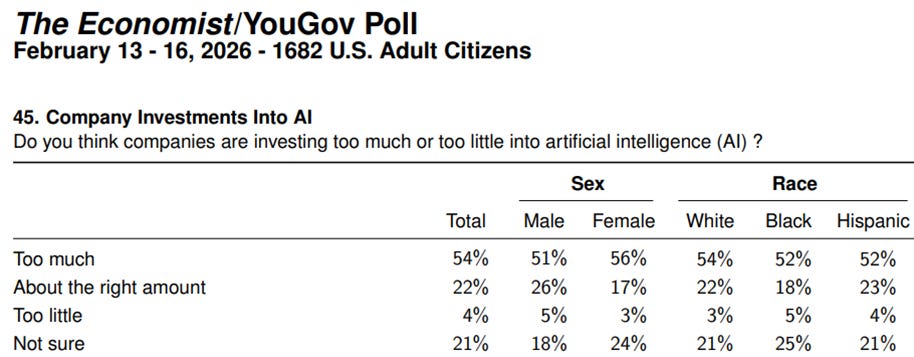
February Charts of Interest: Is Too Much Being Spent on AI?

cans think companies are spending too much on AI. What’s interesting is that respondents’ opinions are similar across gender, race and education level.
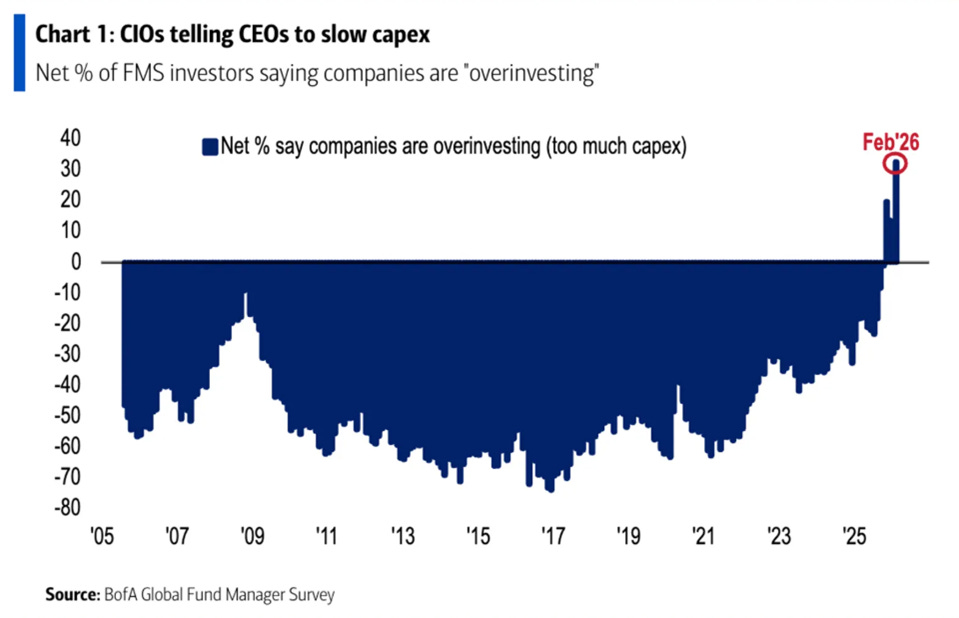
Coincidently, Bank of America’s latest global fund manager survey also found a jump in the number of portfolio managers who want companies to reduce their spending on AI-related investments, reported Axios.
AI’s Demand for Power Is Forecast to Keep Soaring
Captain James T. Kirk’s call for “more power” is yet another element of Star Trek that we’re now mimicking in the real world. Data center demand for electricity has been soaring and is projected to continue rising, as depicted in this forecast from the Union of Concerned Scientists (UCS). (The “LBNL” abbreviation in the chart below stands for Lawrence Berkeley National Laboratory.)
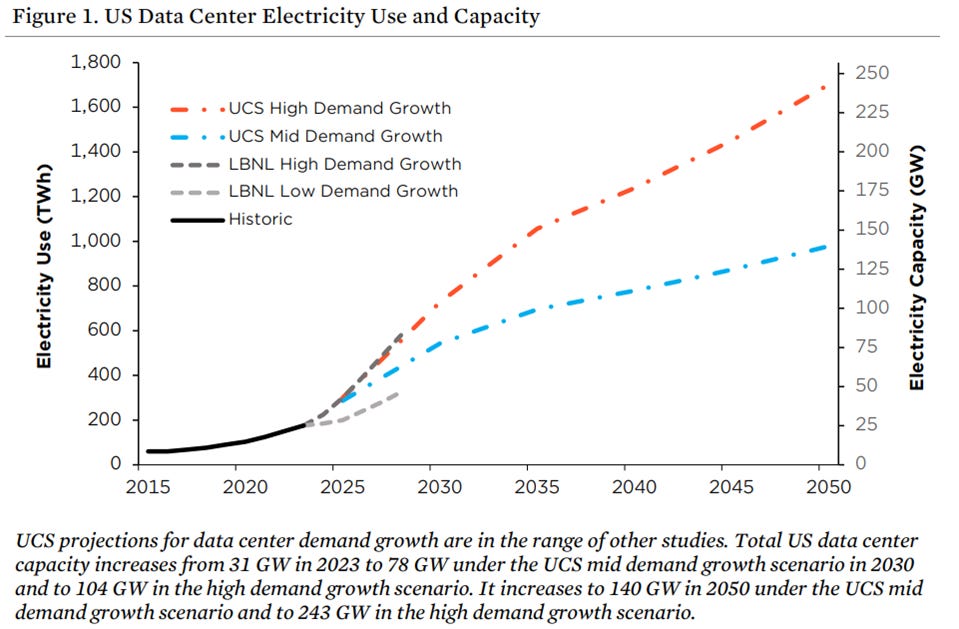
Source: Union of Concerned Scientists.
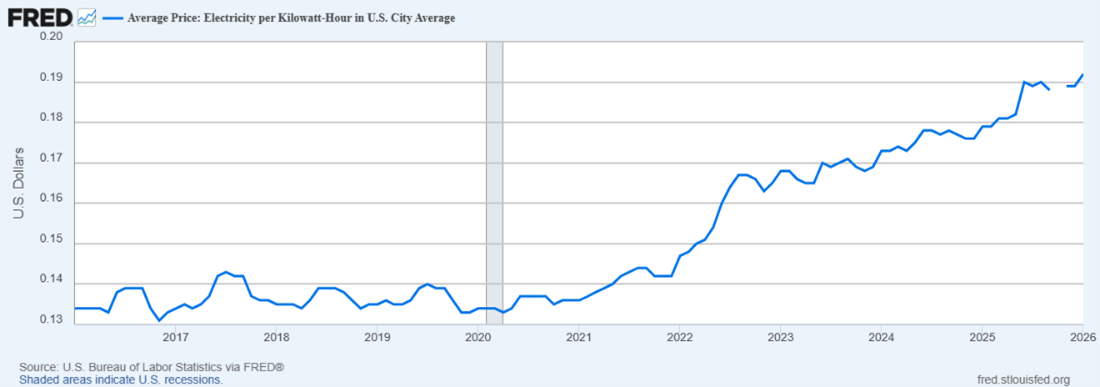
AI data centers’ rising electricity consumption is being blamed for higher electricity costs across the U.S. Past underinvestment in our electricity grid and rising natural gas prices are big culprits too.
The latest consumer price index (CPI) report showed electricity prices up 6.3% over the 12-month period ended January 2026. To put this increase into perspective, the chart below from the St. Louis Federal Reserve’s FRED database shows the 10-year trend in electricity prices per kilowatt-hour.
Bitcoin’s Price Trend Breaks From Technology Stocks
A split emerged last year between technology stocks and bitcoin, as this chart from Topdown Charts’ Callum Thomas shows. Prices of the cryptocurrency declined, while technology stocks continued to climb (well, until the past few weeks). The growing use of AI explains the rise in technology stocks, and the recent turbulence too.
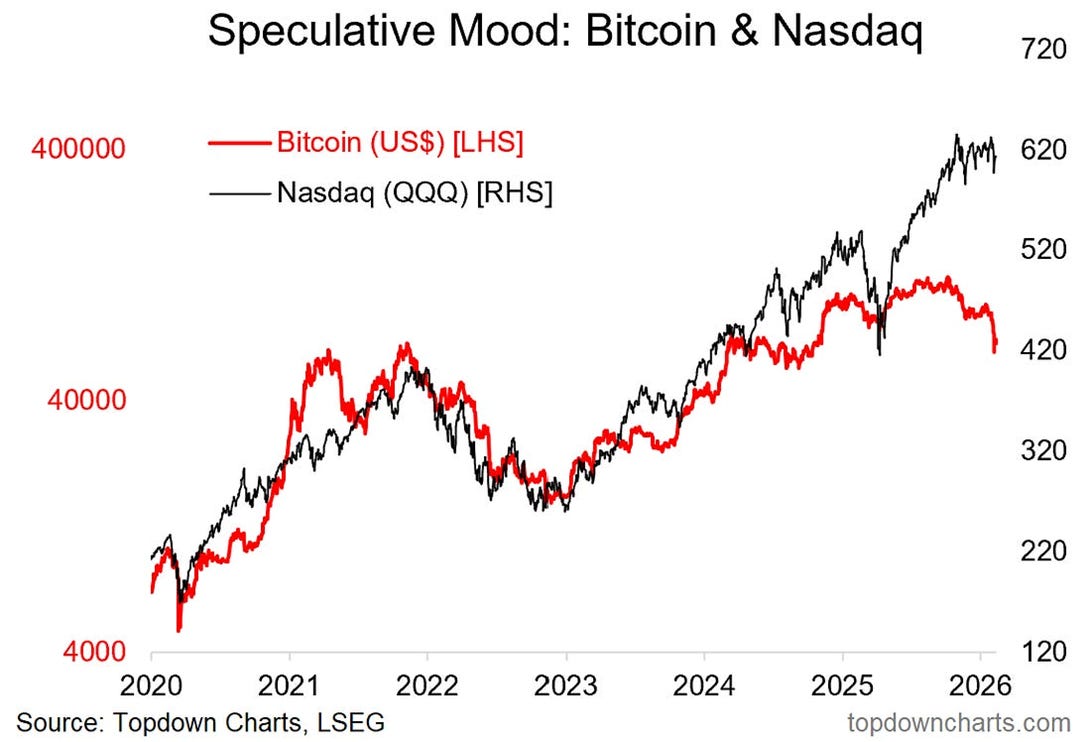
Our friends at Unchained have cited a few events contributing to bitcoin’s recent drop. They include traders liquidating their positions in cryptocurrencies, a break below price support levels and a more risk-averse stance by investors. (Unchained writes our Bits + Bips newsletter about the crypto industry.)
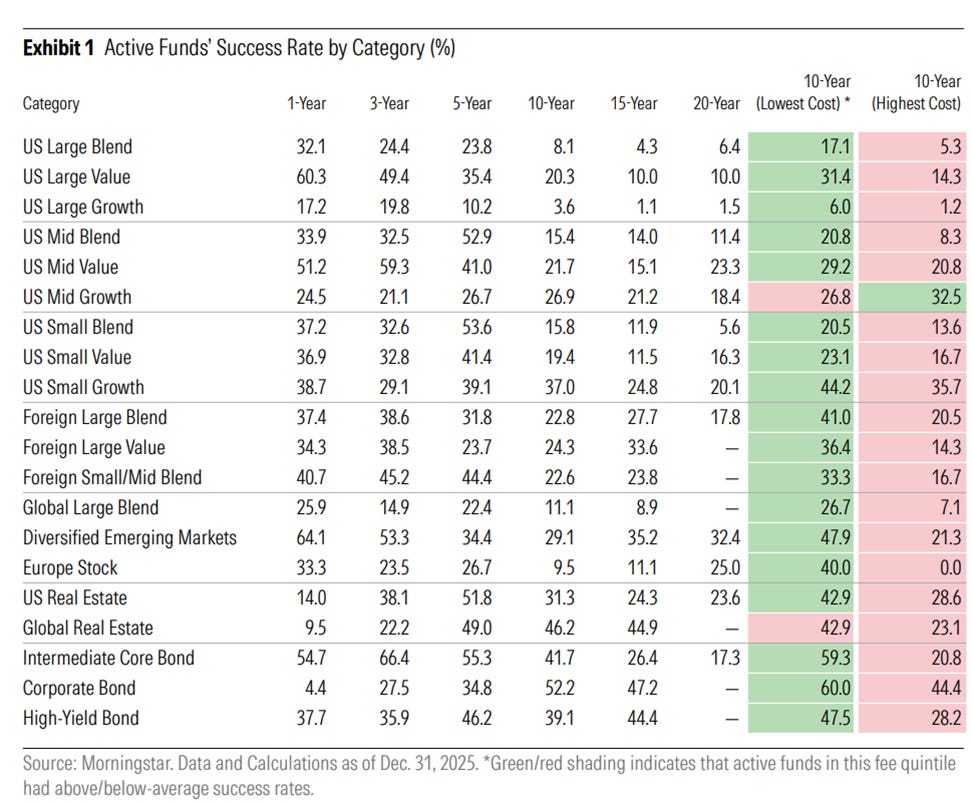
It’s Still Not Easy Being an Active Fund Manager
Morningstar’s latest US Active/Passive Barometer shows that actively managed exchange-traded funds (ETFs) and mutual funds continued to lag their index counterparts last year. The lowest success rates occurred among funds targeting large-cap U.S. stocks. These are the stocks that receive the most attention, thereby making it harder to spot a positive or negative trait that others have missed. (The full report is available on Morningstar, though an email address is required to access it.)

More on AAII.com
An Intro to AI-Powered Investing: How Individual Investors Can Leverage LLMs
Artificial intelligence can enhance investment research and decision-making, but it should be used carefully.Active Strategies That Have Fared Well Among Mutual Funds and ETFs
When evaluating active strategies, consider manager tenure, differentiated strategies and segments with less competition for active managers.The Individual Investor’s Guide to the Top Mutual Funds 2026
The February 2026 AAII Journal reports that precious metals and foreign stock funds realized the highest returns last year; plus, mutual funds moved closer to launching ETF share classes.
AAII Sentiment Survey
Neutral sentiment among individual investors about the short-term outlook for stocks increased in the latest AAII Sentiment Survey. Meanwhile, optimism and pessimism decreased.
Bullish sentiment, expectations that stock prices will rise over the next six months, decreased 4.0 percentage points to 34.5%. Bullish sentiment is below its historical average of 37.5% for the first time in 12 weeks.
Neutral sentiment, expectations that stock prices will stay essentially unchanged over the next six months, increased 5.2 percentage points to 28.5%. Neutral sentiment is below its historical average of 31.5% for the 83rd time in 85 weeks.
Bearish sentiment, expectations that stock prices will fall over the next six months, decreased 1.2 percentage points to 36.9%. Bearish sentiment is above its historical average of 31.0% for the fifth time in 12 weeks.
The bull-bear spread (bullish minus bearish sentiment) decreased 2.8 percentage points to –2.4%. The bull-bear spread is below its historical average of 6.5% for the second time in 12 weeks.
This week’s special question asked AAII members how they prefer companies to return cash to shareholders.
Here is how they responded:
I like companies that use both dividends and buybacks: 40.8%
I prefer dividends for the regular income stream: 37.2%
I prefer stock buybacks for tax efficiency: 12.4%
Not sure/no opinion: 8.7%
This week’s Sentiment Survey results:
Bullish: 34.5%, down 4.0 points
Neutral: 28.5%, up 5.2 points
Bearish: 36.9%, down 1.2 points
Historical averages:
Bullish: 37.5%
Neutral: 31.5%
Bearish: 31.0%
See more Sentiment Survey results.