
Activist-Owned Competitors Outperform Activist Targets

When an activist investor takes a significant stake in a publicly traded company, it often makes news. Such investment firms (typically hedge funds) pressure a company’s management to make changes intended to boost the share price. This week’s termination of Southwest Airlines Co.’s (LUV) open seating policy is an example of a company caving to pressure by an activist investor.
What we don’t hear about are the investments that activists make in competitors of the companies they target. A study recently published on the SSRN website found that more than one-third of campaigns involve activists making investments in both the target company and the company’s competitors.
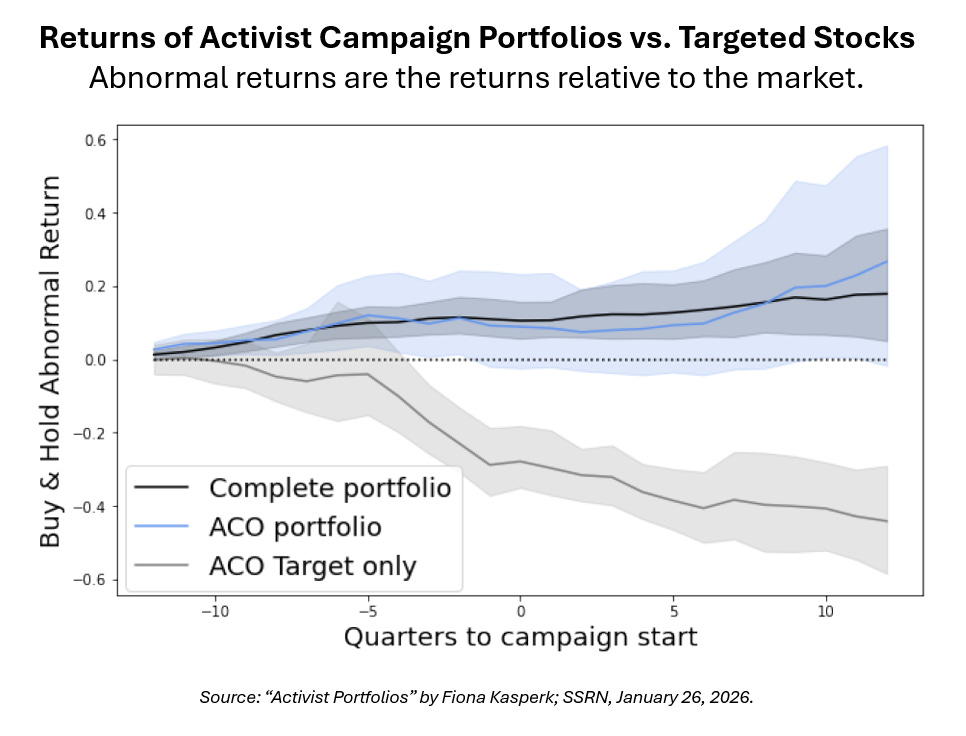
Though the competitors are never targeted, they have been primarily responsible for the investment gains realized by activist campaigns. Examining campaigns from 2005–2016, the study found that target-only portfolios underperformed the market by 42.9%, while portfolios including activist-owned competitors beat the market by 26.0%—an over 68 percentage-point difference over the six-year periods analyzed.
The amounts invested in the targeted company and its competitors vary. The average stake size in an activist common ownership (ACO) target is 7.9% of the activist investor’s assets under management (AUM), while the average aggregate holdings in ACO competitors amount to 23.7% of AUM. Activist investors, on average, invest more in a target company’s biggest competitor than in the target company itself.
Targeted firms tend to be smaller and have lower recent returns than the average publicly traded corporation. Their competitors tend to be larger with stocks experiencing above-average recent returns.
There is a reason why both the targeted company and its competitors are held in the same portfolio: “Three-year buy-and-hold abnormal returns to the portfolios of activist commonly owned targets and competitors significantly outperform the target-only campaign returns. Before the campaign announcement, portfolio diversification provides a hedge against the downside risk from deteriorating target performance. After the campaign starts, the portfolio of target and ACO competitors outperforms the market and the activists’ overall portfolio.”
Identifying the competitors of companies targeted by activist investors requires some work. The U.S. Securities and Exchange Commission’s (SEC) EDGAR database is a good place to start. You will want to run a search on the name of the activist investor’s firm. Then look through Schedule 13D (disclosure of more than a 5% stake in a publicly traded company) and Schedule 13F (a reporting form filed by institutional investors).
The holdings of 13D Activist A fund (DDDAX) are another potential source of information. The mutual fund invests in companies targeted by activist investors. However, it does not disclose its holdings daily. This fund is also expensive to own, with a 1.76% expense ratio and maximum load of 5.75%.
Since this research process is tedious, an alternative method would be to scan headlines for companies that are coming under activist investor pressure and buy exchange-traded funds (ETF) that track their industry peers. A risk to this approach is not getting exposure to the same competitors invested in by the activist investors.
Keep in mind that attempting to replicate the strategy of activist investors is a speculative approach. The activist investor has more information than you do and will not always be right, either.

More on AAII.com
Activist Interventions Fail to Boost Long-Term Returns for Shareholders
A research review found no lasting improvement in the operating performance of companies targeted by hedge fund intervention.EDGAR
What you can find at the SEC’s EDGAR site for company financial statement filings.Bitcoin and Beyond: Your Options for Investing in Crypto
The world of cryptocurrency continues to evolve as it garners mainstream acceptance from governments, traditional financial institutions and investors. Read more in the January 2026 AAII Journal.
AAII Sentiment Survey
Pessimism among individual investors about the short-term outlook for stocks decreased in the latest AAII Sentiment Survey. Meanwhile, optimism and neutral sentiment increased.
Bullish sentiment, expectations that stock prices will rise over the next six months, increased 1.2 percentage points to 44.4%. Bullish sentiment is above its historical average of 37.5% for the ninth time in 12 weeks.
Neutral sentiment, expectations that stock prices will stay essentially unchanged over the next six months, increased 0.7 percentage points to 24.8%. Neutral sentiment is below its historical average of 31.5% for the 80th time in 82 weeks.
Bearish sentiment, expectations that stock prices will fall over the next six months, decreased 1.9 percentage points to 30.8%. Bearish sentiment is slightly below its historical average of 31.0% for the sixth time in nine weeks.
The bull-bear spread (bullish minus bearish sentiment) increased 3.2 percentage points to 13.6%. The bull-bear spread is above its historical average of 6.5% for the 13th time in 52 weeks.
This week’s special question asked AAII members which factor is most influencing their six-month outlook for stocks.
Here is how they responded:
The economy and/or inflation: 35.0%
Geopolitics: 29.1%
Valuations: 15.5%
Monetary policy/interest rates: 13.6%
Other: 6.4%